I8WCTM2000
MGP Instruments Inc.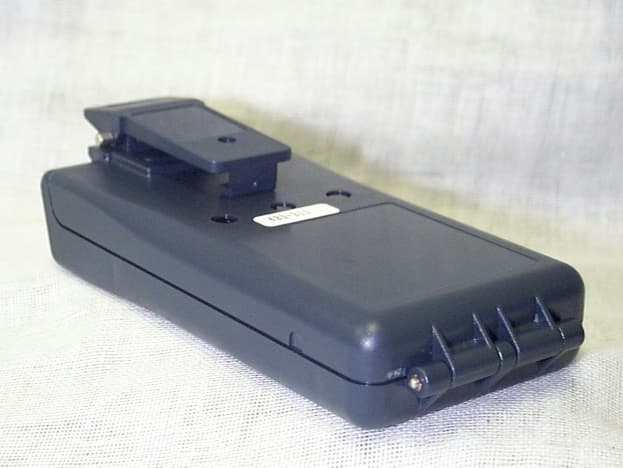
Click to zoom
Application Details
- Equipment Class
- DSS - Part 15 Spread Spectrum Transmitter
- Date of Grant
- Apr 01, 1999
- Application Purpose
- Original Equipment
- Date of Application
- Feb 18, 1999
- Frequency Range
- 905.50000000 - 924.50000000
- Company
- MGP Instruments Inc.
- Country
- United States
Documents & Files
Document Text
Text extracted from the exhibit documents filed with the FCC. Open a document above to read the original.
Users Manual
Apex Wireless / Schlumberger Confidential1 HR23x0 Theory of operation 1.1. System Architecture A conventional superheterodyne architecture is used for this receiver. The receiver interface is a standard RS-232 interface. The system architecture is shown in the following block diagram. 130.38 MHz BPF 10.7 MHz BPF 150 KHz BW 10.7 MHz BPF 400 KHz BW 80.7 MHz 2nd LO RSSI Det Wide Band RSSI Det Narrow Band PLL IC Schlumberger Proposed Universal Receiver Block Diag IF AMP IF AMP Frequency Discriminator Mux / ADC Data Detector / Radio Driver uP Atmel AVR PLL Control Lines DDS Synthesizer PLL Ref Freq 8052 uP Interface Logic RS232 Port 1st LO RF 1st IF Radio PCB Digital PCB 2. Receiver Functional Architecture and Design The drawing illustrated above shows the system block diagram The digital section incorporates a DDS synthesizer, which will allow for fast frequency scanning. 2.1. Signal Detection / Frequency Scanning Apex Wireless / Schlumberger Confidential2 Since the receiver has no advance knowledge of the frequency or timing of the transmitter, it must scan the frequency band in search of transmitters. The receiver is able to implement a fast scan rate by locking a conventional LO PLL to a fast scanning direct digital synthesizer (DDS). This technique is implemented as illustrated below: DDS AD9831 16 MHz XTAL Div 0 ms 4.043 MHz 3.986 MHz Fref Fref Microprocessor Digital PCBRad Schlumberger Universal Receiver F Atmel AVR As the drawing above indicates, to incorporate the “fast scan” capability, the receiver uses a DDS synthesizer IC to “drive” our conventional phase locked loop. This technique also allows for an increase in the PLL reference frequency well above the channel spacing (800 KHz nom) , which allows us to use a wide loop bandwidth, and insure good tracking of the input frequency, with little “ringing” on the output frequency. 2.2. Data Detection As is indicated on the Block Diagram, data is detected using a combination of a wide and narrow band IF filter section. The wide band filter section gives us a longer time to make a data/no data determination during the frequency scan. For example, with the wide band filter bandwidth of 400 KHz, a frequency sweep of 10 MHz, and a sweep time of 1.5 ms, the data window will be 400 KHz/10MHz * 1.5ms = 60us. If the data code is guaranteed to have an “on bit” during this window, than it will be possible to determine the presence of a data transmitter. Apex Wireless / Schlumberger Confidential3 Once a data pulse is detected, the sweep will stop and the remaining data bits will be detected. By looking at the frequency discriminator output, we can determine if our local oscillator center frequency is high or low, and estimate the required correction necessary to center it. Once this correction is made, the detector can switch to the narrow band IF channel to achieve an improvement in sensitivity. If it is determined that a transmitter burst has been detected, the frequency and start time of this burst can be stored for a spread spectrum implementation. Both data / no data determination and the data demodulation detection are made using high speed ADC’s closely coupled to the microprocessor. 3. Firmware Design The receiver control operation is split over two processors: the control processor for receiver control and interface to the serial port, and a high-speed decoding processor for frequency control and data demodulation. The first processor is used for Reed-Solomon error correction if that feature is implemented. The decoding processor controls the receiver frequency, including generating a high- speed sweep used to locate potential meter transmitter signals. Once a signal is found in the operating band, the processor locks onto the frequency, using both amplitude and frequency discrimination techniques, in time to sample transmitted data. If the modulation timing is incompatible with the expected transmitter characteristics, the signal is skipped and the search for valid transmitter signals continues. When the incoming data disappears, due to packet completion, the processor frames the data portion and tests it for valid data in either of the two supported formats. If the data is formatted correctly, it is sent to the serial interface processor for transmission. The decoding processor also keeps track of interfering frequencies, so that decoding is not attempted on each scan. This significantly improves the percentage of time that is available to catch a meter signal.
Cover Letter(s)
MGP Instruments, Inc. FCC Part 15, Certification Application Transmitter, CTM 2000, WRM-9201 February 17, 1999 FCC ID: I8WCTM2000 FCC ID: I8WCTM2000
External Photos
FCC ID: I8WCTM2000 SECTION 5 PHOTOGRAPHS FCC ID: I8WCTM2000 PHOTOS OF THE TESTED EUT The following photos are attached: External Views: Photo 1.EUT, Front 3-D View Photo 2.EUT, Back 3-D View Photo 3.EUT, Front View Showing LCD Display Photo 4.EUT, Top View Showing Depression for Label Internal Views: Photo 5.EUT, Case Opened Showing DMC2000 Dosimeter In Place Photo 6.EUT, Case Opened Showing DMC2000 Dosimeter Removed Photo 7.Front 3-D View of Dosimeter Photo 8.Back 3-D View of Dosimeter Photo 9.Top View of Dosimeter Photo 10.Bottom View of Dosimeter Photo 11.EUT, with Battery Shield removed Photo 12.Top View of Voltage Booster Board Photo 13.Bottom View of Voltage Booster Board Photo 14.Top View of Transceiver Board with Shield Installed Photo 15.Top View of Transceiver Board with Shield Removed Photo 16.Top View of Transceiver Board with Secondary Shield Removed Photo 17.Bottom View of Transceiver Board Showing Antenna FCC ID: I8WCTM2000 Photo 1. EUT, Front 3-D View FCC ID: I8WCTM2000 Photo 2. EUT, Back 3-D View FCC ID: I8WCTM2000 Photo 3. EUT, Front View Showing LCD Display FCC ID: I8WCTM2000 Photo 4. EUT, Top View Showing Depression for Label
External Photos
FCC ID: I8WCTM2000 Photo 11. EUT, with Battery Shield removed FCC ID: I8WCTM2000 Photo 12. Top View of Voltage Booster Board FCC ID: I8WCTM2000 Photo 13. Bottom Viewof Voltage Booster Board FCC ID: I8WCTM2000 Photo 14. Top View of Transceiver Board with Shield Installed FCC ID: I8WCTM2000 Photo 15. Top View of Transceiver Board with Shield Removed FCC ID: I8WCTM2000 Photo 16. Top View of Transceiver Board with Secondary Shield Removed FCC ID: I8WCTM2000 Photo 17. Bottom View of Transceiver Board Showing Antenna
ID Label/Location Info
FCC ID: I8WCTM2000 SECTION 3 LABELING INFORMATION FCC ID: I8WCTM2000 The following photograph shows the positioning of the label.
Internal Photos
FCC ID: I8WCTM2000 Photo 5. EUT, Case Opened Showing DMC2000 Dosimeter In Place FCC ID: I8WCTM2000 Photo 6.EUT, Case Opened Showing DMC2000 Dosimeter Removed FCC ID: I8WCTM2000 Photo 7. Front 3-D View of Dosimeter FCC ID: I8WCTM2000 Photo 8. Back 3-D View of Dosimeter FCC ID: I8WCTM2000 Photo 9. Top View of Dosimeter FCC ID: I8WCTM2000 Photo 10. Bottom View of Dosimeter
Test Report
STRATEGIC Technologies Inc.Quick Install Quick Install The Quick Install feature enables the installer to easily setup the PRU+ / PID set and have the PRU+ determine if the setup is completed. The Quick Install feature is designed to prompt the installer for any setup requirements that have not been met. Once all the criteria has been met the unit will automatically call into the Central Computer and pick up it’s final configuration settings. The Quick Install will display different messages depending on what is still required. The PRU+ will scan the list of requirements and prompt for the next one needed. The list is as follows: 1. Telephone Line is present 2. AC is connected 3. PRU+ Case is closed 4. PID has transmitted / PID has been received by PRU+ 5. PID has transmitted with a Strap Severe ok indication 6. PID has transmitted with a Case ok indication 7. PID has transmitted with a Battery ok indication Once these conditions have been met the PRU+ will indicate that everything is ok and will call the Central Computer. If the PRU indicates “Call Successful” the installation is complete. STRATEGIC Technologies Inc.Quick Install Motion Sensor The Platinum Plus Receiver (PRU+) contains a sensor which will report motion if the receiver is moved by the participant once it has been installed. Normal household activities could cause movement such as the receiver being bumped or being moved to clean. When the PRU+ senses motion, it will immediately record a motion event. In order to move the receiver any distance it would be necessary for the participant to disconnect both the AC power and telephone. If the receiver records a Telephone Disconnect, Telephone Connect, AC Disconnect and/or AC Connect event within two (2) minutes before or after an motion event, the motion event will be recorded as an “Alarm Motion”. If there is no Telephone or AC message, the motion event will be recorded as an “..info motion” message. The following examples show various ways the motion is reported and when a motion alarm would be reported: A. An AC or telephone event occurs, then within two minutes a motion event occurs, the receiver will report the following: Event reportedExplanation Alarm No AC- AC was disconnected, no previous motion was recently evident Alarm Motion- motion is sensed within 2 minutes of the AC disconnect. B. A motion event occurs, there was no prior AC or Telephone related event, the receiver will report the following: Event reportedExplanation ..Info Motion- motion was sensed, no previous recent AC or Telephone event. C. Motion occurs, then within 2 minutes an AC or Telephone disconnect occurs, the receiver will report the following: Event reportedExplanation ..Info Motion- motion was sensed, no previous recent AC or Telephone event. Alarm Tel. Disc.- the telephone was disconnected from the receiver Alarm Motion- the telephone disconnect occurred within 2 minutes of the first motion event STRATEGIC Technologies Inc.PRU / PID Preventive Maintenance PRU+ / PID Preventive Maintenance Returned PRU+'s Physical Checks 1.Check all cables for cut's or breakage. 2.Make sure the AC and Telephone cable connectors are firmly attached to their cords and are not broken. Also check that any connector pins are not bent. 3.Check Power Connector Jack at the back of the PRU+. The Power Jack should be flush with the outside case and should not move when pulled upon. The Power Jack should also have one copper pin inside each of the two sections of the connector. 4.Check Telephone Connector Jacks at the back of the PRU+. The Two Telephone Jacks should be aligned with the two holes in the back of the PRU+ and should be clear of any foreign material. Remove any foreign material found if possible. If the foreign material can not be removed send the unit back to STRATEGIC for repair. 5.If a PRU+ is dirty or has any foreign substance on it, wipe the entire PRU+ with a damp cloth. If the dirt is still attached take isopropyl alcohol and rub to remove. If Isopropyl Alcohol is not available, spray the PRU+ lightly with Lysol to disinfect. 6.Check the screw plugs underneath the PRU+ for pry marks or gouges. The screw plugs are located next to the rubber feet at the back of the unit and on the raised ledge at the front of the unit. (See Figure 4 : Underneath a PRU+) Figure 7 : Underneath a PRU+ 7.Check all labels to make sure they haven't been severely scratched or damaged in any way. Send unit back for replacement of any label that shows any sign of damage. Replacement Labels can be obtained from STRATEGIC. 8.Check that the front display is not physically damaged including the label cover. STRATEGIC Technologies Inc.PRU / PID Preventive Maintenance Electrical Checks 1.Plug the unit into the AC Power and make sure that the AC light comes on. If the unit needs charging the Charge Light should come on. Leave the unit plugged into AC until the charge light goes out. This should also be done to all PRU+’s that are stored for longer than one month. The battery inside the PRU+ can be damaged by leaving it in a discharged state. 2.The front display should display the PRU+ Serial Number / PID Code. The Display will then show the current date and time. If any of these numbers are incorrect, Change them to the right values by using Extended Special Function Mode (As Described on Page 38). 3.Using Special Function Mode on a PRU+ enter Test Mode and check the AC and Telephone Disconnect by unplugging the cables from their respective outlets (For more Information concerning Test Mode consult Page 33). Figure 8 : Test Mode Display 4.The stored events should be erased each time the unit is changed from one participant to another. Be careful because once the events have been erased they can never be retrieved. To erase the events, enter Special Function Mode and step through the functions until B=Clear Events appears. Push button B once. The display will then prompt A=** Clear ** Press A to erase the events. Once the events have been …
Text truncated - open the document above for the full version.
Test Report
FCC ID: I8WCTM2000 2.13 Processing Gain Data regarding processing gain has been provided on the following page from Digital Wireless. FCC ID: I8WCTM2000 FCC ID: I8WCTM2000 FCC ID: I8WCTM2000 FCC ID: I8WCTM2000 FCC ID: I8WCTM2000 FCC ID: I8WCTM2000 FCC ID: I8WCTM2000 FCC ID: I8WCTM2000 FCC ID: I8WCTM2000 2.14 Power Line Conducted Emissions for Transmitter FCC Section 15.207 The conducted voltage measurements have been carried out in accordance with FCC Section 15.207, with a spectrum analyzer connected to a LISN and the EUT placed into a continuous mode of transmit. The results are given in Table 8. FCC ID: I8WCTM2000 TABLE 8. CONDUCTED EMISSIONS DATA CLASS B Test Date:January 21, 1999 UST Project: CTM 2000, WRM-9201 Customer: MGP Instruments, Inc. Product: Transmitter, CTM 2000, WRM-9201 Frequency (MHz) Test Data (dBm) Phase Neutral RESULTS (uV) Phase Neutral FCC Limits (uV) EUT is Battery Powered Therefore Conducted Emissions were deemed Not Applicable Tester Signature: Name: Tim R. Johnson FCC ID: I8WCTM2000 2.15 Radiated Emissions (47 CFR 15.109a) Radiated emissions were evaluated from 30 to 5000 MHz. Measurements were made with the analyzer's bandwidth set to 120 kHz measurements made less than 1 GHz and 1 MHz are shown in Table 8a. Measurements made over 1 GHz results are shown in Table 8b. Even thought the EUT is considered a class A device, it met with the requirements of a class B device. FCC ID: I8WCTM2000 TABLE 8a. RADIATED EMISSIONS DATA CLASS B Test Date:January 21, 1999 UST Project: CTM 2000, WRM-9201 Customer: MGP Instruments, Inc. Product: Transmitter, CTM 2000, WRM-9201 Frequency (MHz) Receiver Reading (dBm) @3m Correction Factor (dB) Corrected Reading (uV/m) FCC Limit (uV/m) @3m No readings were seen within 10 dB of the FCC limits *= Quasi Peak Tester Signature: Name: Tim R. Johnson FCC ID: I8WCTM2000 FCC ID: I8WCTM2000 TABLE 8b. RADIATED EMISSIONS DATA CLASS B Test Date:January 21, 1999 UST Project:CTM 2000, WRM-9201 Customer:MGP Instruments, Inc. Model:Transmitter, CTM 2000, WRM-9201 Measurements >1GHz FREQ. (GHz) TEST DATA (dBm) @ 3m AMP GAIN (dB) ANT. FACTOR (dB) CABLE LOSS (dB) RESULTS (uV/m) @ 3m FCC LIMITS (uV/m) @ 3m No readings seen within 10 dB of the FCC Limit Tested By Signature: Name: Tim R. Johnson
Test Report
FCC ID: I8WCTM2000 2.8 Antenna Conducted Spurious Emission in the Frequency Range 30 - 10000 MHz (FCC Section 15.247(c)) Spurious emissions in the frequency range 30 - 10000 usually are measured with a spectrum analyzer by connecting the spectrum analyzer directly via a short cable to the antenna output terminals or across the antenna leads on the PCB as specified by the manufacturer. Since the EUT does not contain a removable antenna, this test was deemed unnecessary. FCC ID: I8WCTM2000 Figure 4a Antenna Conducted Spurious Emissions 15.247(c) Low EUT does not have an external antenna port, therefore antenna conducted emissions were deemed not applicable FCC ID: I8WCTM2000 2.9 Peak Radiated Spurious Emission in the Frequency Range 30 -10000 MHz (FCC Section 15.247(c)) A preliminary scan was performed on the EUT to determine frequencies that were caused by the transmitter portion of the product. Significant emissions that fell within restricted bands were then measured on an OAT’s site. Radiated measurements below 1 GHz were tested with a RBW = 120 kHz. Radiated measurements above 1 GHz were measured using a RBW = VBW = 1 MHz. The results of peak radiated spurious emissions falling within restricted bands are given in Table 4a (low), Table 4b, (mid), Table 4c (high) and Figure 5a (low), Figure 5b (mid) and Table 5c (high). FCC ID: I8WCTM2000 Figure 5a Peak Radiated Spurious Emission 15.247(c) Low FCC ID: I8WCTM2000 Figure 5b Peak Radiated Spurious Emission 15.247(c) Low FCC ID: I8WCTM2000 Figure 5c Peak Radiated Spurious Emission 15.247(c) Low FCC ID: I8WCTM2000 Figure 5d Peak Radiated Spurious Emission 15.247(c) Low FCC ID: I8WCTM2000 Figure 5e Peak Radiated Spurious Emission 15.247(c) Mid FCC ID: I8WCTM2000 Figure 5f Peak Radiated Spurious Emission 15.247(c) Mid FCC ID: I8WCTM2000 Figure 5g Peak Radiated Spurious Emission 15.247(c) Mid FCC ID: I8WCTM2000 Figure 5h Peak Radiated Spurious Emission 15.247(c) Mid FCC ID: I8WCTM2000 Figure 5i Peak Radiated Spurious Emission 15.247(c) High FCC ID: I8WCTM2000 Figure 5j Peak Radiated Spurious Emission 15.247(c) High FCC ID: I8WCTM2000 Figure 5k Peak Radiated Spurious Emission 15.247(c) High FCC ID: I8WCTM2000 Figure 5l Peak Radiated Spurious Emission 15.247(c) High FCC ID: I8WCTM2000 TABLE 4a PEAK RADIATED SPURIOUS EMISSIONS (Low) Freq. (GHz) Test Data* (dBm) @3m Amp. Gain (dB) Antenna Factor (dB) Cable Loss (dB) Results (uV/m) @3m FCC Limits (uV/m) @3m 2.716-50.034.631.43.8758.85000 3.622-56.334.433.04.4486.25000 4.528-45.534.334.24.41956.15000 5.433-45.734.236.04.92526.05000 TABLE 4b PEAK RADIATED SPURIOUS EMISSIONS (Mid) Freq. (GHz) Test Data* (dBm) @3m Amp. Gain (dB) Antenna Factor (dB) Cable Loss (dB) Results (uV/m) @3m FCC Limits (uV/m) @3m 2.745-39.934.631.43.82438.75000 3.660-56.034.433.24.5513.15000 4.576-54.234.334.34.4722.45000 7.320-61.634.537.26.8557.75000 * = Data adjusted by + 1 dB for high pass filter ** = Instrumentation ground floor SAMPLE CALCULATION: RESULTS (uV/m @ 3m) = Antilog ((-50.0 - 34.6 + 31.4 + 3.8 + 107)/20) = 758.8 CONVERSION FROM dBm TO dBuV = 107 dB Tester Signature: Name: Tim R. Johnson FCC ID: I8WCTM2000 TABLE 4c PEAK RADIATED SPURIOUS EMISSIONS (High) Freq. (GHz) Test Data* (dBm) @3m Amp. Gain (dB) Antenna Factor (dB) Cable Loss (dB) Results (uV/m) @3m FCC Limits (uV/m) @3m 2.774-48.534.631.53.8910.35000 3.698-54.534.433.34.5621.75000 4.622-47.634.334.44.31552.75000 7.396-61.534.537.46.8578.75000 * = Data adjusted by + 1 dB for high pass filter ** = Instrumentation ground floor SAMPLE CALCULATION: RESULTS (uV/m @ 3m) = Antilog ((-48.5 - 34.6 + 31.5 + 3.8 + 107)/20) = 910.3 CONVERSION FROM dBm TO dBuV = 107 dB Tester Signature: Name: Tim R. Johnson FCC ID: I8WCTM2000 2.10 Average Spurious Emission in the Frequency Range 30 - 10000 MHz (FCC Section 15.247(c)) The results of average radiated spurious emissions falling within restricted bands are given in Table 5a (low), Table 5b, (mid), Table 5c (high). Figures 6a & Figure 6b show the characteristics of the worse case duty cycle of the transmitter. Duty Cycle Correction During 100 msec: The EUT as measured was considered to be 0.016ms/100 ms = 16.0% Duty Cycle correction = 20 log (0.016) = -15.9 dB FCC ID: I8WCTM2000 Figure 6a Average Radiated Spurious Emission 15.247(c) Low FCC ID: I8WCTM2000 Figure 6b Average Radiated Spurious Emission 15.247(c) Low FCC ID: I8WCTM2000 TABLE 5a AVERAGE RADIATED SPURIOUS EMISSIONS (Low) Freq. (GHz) Test Data* (dBm) @3m Amp. Gain (dB) Antenna Factor (dB) Cable Loss (dB) Results (uV/m) @3m FCC Limits (uV/m) @3m 2.716-65.934.631.43.8121.7500 3.622-72.234.433.04.478.0500 4.528-61.434.334.24.4313.6500 5.433-61.634.236.04.9405.0500 TABLE 5b AVERAGE RADIATED SPURIOUS EMISSIONS (Mid) Freq. (GHz) Test Data* (dBm) @3m Amp. Gain (dB) Antenna Factor (dB) Cable Loss (dB) Results (uV/m) @3m FCC Limits (uV/m) @3m 2.745-55.834.631.43.8391.0500 3.660-71.934.433.24.582.3500 4.576-70.134.334.34.4115.8500 7.320-77.534.537.26.889.4500 * = Data adjusted by + 1dB for high pass filter & 15.9 dB for duty cycle. ** = Instrumentation ground floor. SAMPLE CALCULATION: RESULTS (uV/m @ 3m) = Antilog ((-65.9 - 34.6 + 31.4 + 3.8 + 107)/20) = 121.7 CONVERSION FROM dBm TO dBuV = 107 dB Tester Signature: Name: Tim R. Johnson FCC ID: I8WCTM2000 TABLE 5c AVERAGE RADIATED SPURIOUS EMISSIONS (High) Freq. (GHz) Test Data* (dBm) @3m Amp. Gain (dB) Antenna Factor (dB) Cable Loss (dB) Results (uV/m) @3m FCC Limits (uV/m) @3m 2.774-64.434.631.53.8145.9500 3.698-70.434.433.34.599.7500 4.622-63.534.334.44.3248.9500 7.396-77.434.537.46.892.8500 * = Data adjusted by + 1dB for high pass filter & 15.9 dB for duty cycle. ** = Instrumentation ground floor. SAMPLE CALCULATION: RESULTS (uV/m @ 3m) = Antilog ((-64.4 - 34.6 + 31.5 + 3.8 + 107)/20) = 145.9 CONVERSION FROM dBm TO dBuV = 107 dB Tester Signature: Name: Tim R. Johnson FCC ID: I8WCTM2000 2.11 Minimum 6 dB Bandwidth per FCC Section 15.247(a)(2) The minimum requirement is given in Figure 7a through 7c. If the EUT incorporate…
Text truncated - open the document above for the full version.
Test Report
FCC ID: I8WCTM2000 2.8 Antenna Conducted Spurious Emission in the Frequency Range 30 - 10000 MHz (FCC Section 15.247(c)) Spurious emissions in the frequency range 30 - 10000 usually are measured with a spectrum analyzer by connecting the spectrum analyzer directly via a short cable to the antenna output terminals or across the antenna leads on the PCB as specified by the manufacturer. Since the EUT does not contain a removable antenna, this test was deemed unnecessary. FCC ID: I8WCTM2000 Figure 4a Antenna Conducted Spurious Emissions 15.247(c) Low EUT does not have an external antenna port, therefore antenna conducted emissions were deemed not applicable FCC ID: I8WCTM2000 2.9 Peak Radiated Spurious Emission in the Frequency Range 30 -10000 MHz (FCC Section 15.247(c)) A preliminary scan was performed on the EUT to determine frequencies that were caused by the transmitter portion of the product. Significant emissions that fell within restricted bands were then measured on an OAT’s site. Radiated measurements below 1 GHz were tested with a RBW = 120 kHz. Radiated measurements above 1 GHz were measured using a RBW = VBW = 1 MHz. The results of peak radiated spurious emissions falling within restricted bands are given in Table 4a (low), Table 4b, (mid), Table 4c (high) and Figure 5a (low), Figure 5b (mid) and Table 5c (high). FCC ID: I8WCTM2000 Figure 5a Peak Radiated Spurious Emission 15.247(c) Low FCC ID: I8WCTM2000 Figure 5b Peak Radiated Spurious Emission 15.247(c) Low FCC ID: I8WCTM2000 Figure 5c Peak Radiated Spurious Emission 15.247(c) Low FCC ID: I8WCTM2000 Figure 5d Peak Radiated Spurious Emission 15.247(c) Low FCC ID: I8WCTM2000 Figure 5e Peak Radiated Spurious Emission 15.247(c) Mid FCC ID: I8WCTM2000 Figure 5f Peak Radiated Spurious Emission 15.247(c) Mid FCC ID: I8WCTM2000 Figure 5g Peak Radiated Spurious Emission 15.247(c) Mid FCC ID: I8WCTM2000 Figure 5h Peak Radiated Spurious Emission 15.247(c) Mid FCC ID: I8WCTM2000 Figure 5i Peak Radiated Spurious Emission 15.247(c) High FCC ID: I8WCTM2000 Figure 5j Peak Radiated Spurious Emission 15.247(c) High FCC ID: I8WCTM2000 Figure 5k Peak Radiated Spurious Emission 15.247(c) High FCC ID: I8WCTM2000 Figure 5l Peak Radiated Spurious Emission 15.247(c) High FCC ID: I8WCTM2000 TABLE 4a PEAK RADIATED SPURIOUS EMISSIONS (Low) Freq. (GHz) Test Data* (dBm) @3m Amp. Gain (dB) Antenna Factor (dB) Cable Loss (dB) Results (uV/m) @3m FCC Limits (uV/m) @3m 2.716-50.034.631.43.8758.85000 3.622-56.334.433.04.4486.25000 4.528-45.534.334.24.41956.15000 5.433-45.734.236.04.92526.05000 TABLE 4b PEAK RADIATED SPURIOUS EMISSIONS (Mid) Freq. (GHz) Test Data* (dBm) @3m Amp. Gain (dB) Antenna Factor (dB) Cable Loss (dB) Results (uV/m) @3m FCC Limits (uV/m) @3m 2.745-39.934.631.43.82438.75000 3.660-56.034.433.24.5513.15000 4.576-54.234.334.34.4722.45000 7.320-61.634.537.26.8557.75000 * = Data adjusted by + 1 dB for high pass filter ** = Instrumentation ground floor SAMPLE CALCULATION: RESULTS (uV/m @ 3m) = Antilog ((-50.0 - 34.6 + 31.4 + 3.8 + 107)/20) = 758.8 CONVERSION FROM dBm TO dBuV = 107 dB Tester Signature: Name: Tim R. Johnson FCC ID: I8WCTM2000 TABLE 4c PEAK RADIATED SPURIOUS EMISSIONS (High) Freq. (GHz) Test Data* (dBm) @3m Amp. Gain (dB) Antenna Factor (dB) Cable Loss (dB) Results (uV/m) @3m FCC Limits (uV/m) @3m 2.774-48.534.631.53.8910.35000 3.698-54.534.433.34.5621.75000 4.622-47.634.334.44.31552.75000 7.396-61.534.537.46.8578.75000 * = Data adjusted by + 1 dB for high pass filter ** = Instrumentation ground floor SAMPLE CALCULATION: RESULTS (uV/m @ 3m) = Antilog ((-48.5 - 34.6 + 31.5 + 3.8 + 107)/20) = 910.3 CONVERSION FROM dBm TO dBuV = 107 dB Tester Signature: Name: Tim R. Johnson FCC ID: I8WCTM2000 2.10 Average Spurious Emission in the Frequency Range 30 - 10000 MHz (FCC Section 15.247(c)) The results of average radiated spurious emissions falling within restricted bands are given in Table 5a (low), Table 5b, (mid), Table 5c (high). Figures 6a & Figure 6b show the characteristics of the worse case duty cycle of the transmitter. Duty Cycle Correction During 100 msec: The EUT as measured was considered to be 0.016ms/100 ms = 16.0% Duty Cycle correction = 20 log (0.016) = -15.9 dB FCC ID: I8WCTM2000 Figure 6a Average Radiated Spurious Emission 15.247(c) Low FCC ID: I8WCTM2000 Figure 6b Average Radiated Spurious Emission 15.247(c) Low FCC ID: I8WCTM2000 TABLE 5a AVERAGE RADIATED SPURIOUS EMISSIONS (Low) Freq. (GHz) Test Data* (dBm) @3m Amp. Gain (dB) Antenna Factor (dB) Cable Loss (dB) Results (uV/m) @3m FCC Limits (uV/m) @3m 2.716-65.934.631.43.8121.7500 3.622-72.234.433.04.478.0500 4.528-61.434.334.24.4313.6500 5.433-61.634.236.04.9405.0500 TABLE 5b AVERAGE RADIATED SPURIOUS EMISSIONS (Mid) Freq. (GHz) Test Data* (dBm) @3m Amp. Gain (dB) Antenna Factor (dB) Cable Loss (dB) Results (uV/m) @3m FCC Limits (uV/m) @3m 2.745-55.834.631.43.8391.0500 3.660-71.934.433.24.582.3500 4.576-70.134.334.34.4115.8500 7.320-77.534.537.26.889.4500 * = Data adjusted by + 1dB for high pass filter & 15.9 dB for duty cycle. ** = Instrumentation ground floor. SAMPLE CALCULATION: RESULTS (uV/m @ 3m) = Antilog ((-65.9 - 34.6 + 31.4 + 3.8 + 107)/20) = 121.7 CONVERSION FROM dBm TO dBuV = 107 dB Tester Signature: Name: Tim R. Johnson FCC ID: I8WCTM2000 TABLE 5c AVERAGE RADIATED SPURIOUS EMISSIONS (High) Freq. (GHz) Test Data* (dBm) @3m Amp. Gain (dB) Antenna Factor (dB) Cable Loss (dB) Results (uV/m) @3m FCC Limits (uV/m) @3m 2.774-64.434.631.53.8145.9500 3.698-70.434.433.34.599.7500 4.622-63.534.334.44.3248.9500 7.396-77.434.537.46.892.8500 * = Data adjusted by + 1dB for high pass filter & 15.9 dB for duty cycle. ** = Instrumentation ground floor. SAMPLE CALCULATION: RESULTS (uV/m @ 3m) = Antilog ((-64.4 - 34.6 + 31.5 + 3.8 + 107)/20) = 145.9 CONVERSION FROM dBm TO dBuV = 107 dB Tester Signature: Name: Tim R. Johnson FCC ID: I8WCTM2000 2.11 Minimum 6 dB Bandwidth per FCC Section 15.247(a)(2) The minimum requirement is given in Figure 7a through 7c. If the EUT incorporate…
Text truncated - open the document above for the full version.
Contact Information
Applicant
David Jarrow(Director, Quality Assurance)
770-432-2744
Technical Contact
United States TechnologiesTimothy R Johnson
[email protected]770-740-0717
3505 Francis Circle · Alpharetta, Georgia · United States
Non-Technical Contact
United States TechnologiesTimothy R Johnson
[email protected]770-740-0717
Test Firm
US TechSandy McEnery
Technical Specifications
| # | Rule Parts | Frequency Range | Power Output |
|---|---|---|---|
| 1 | 15C | 905.5 MHz - 924.5 MHz | 15.00 mW |
Other Applications from MGP Instruments Inc.
I8WCTM101-50
Jan 22, 1995Maximum Output Power: 30 mW
Equipment Class
DSS - Part 15 Spread Spectrum TransmitterI8WWRM91-50
Apr 15, 1992Maximum Output Power: 50 mW
Equipment Class
DSS - Part 15 Spread Spectrum Transmitter