JEE26EElectronic Ballast
Shinkwang Enterprise Co Ltd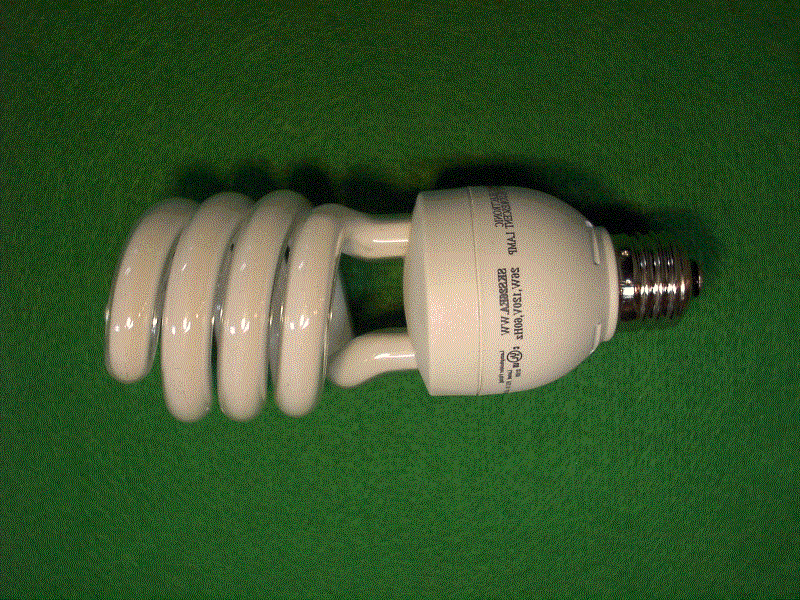
Click to zoom
Application Details
- Equipment Class
- 8CC - Part 18 Consumer Device
- Date of Grant
- Apr 08, 2001
- Application Purpose
- Original Equipment
- Date of Application
- Mar 04, 2001
- Equipment Note
- Electronic Ballast
- Frequency Range
- 0.04500000 - 0.05000000
- Company
- Shinkwang Enterprise Co Ltd
- Country
- South Korea
Documents & Files
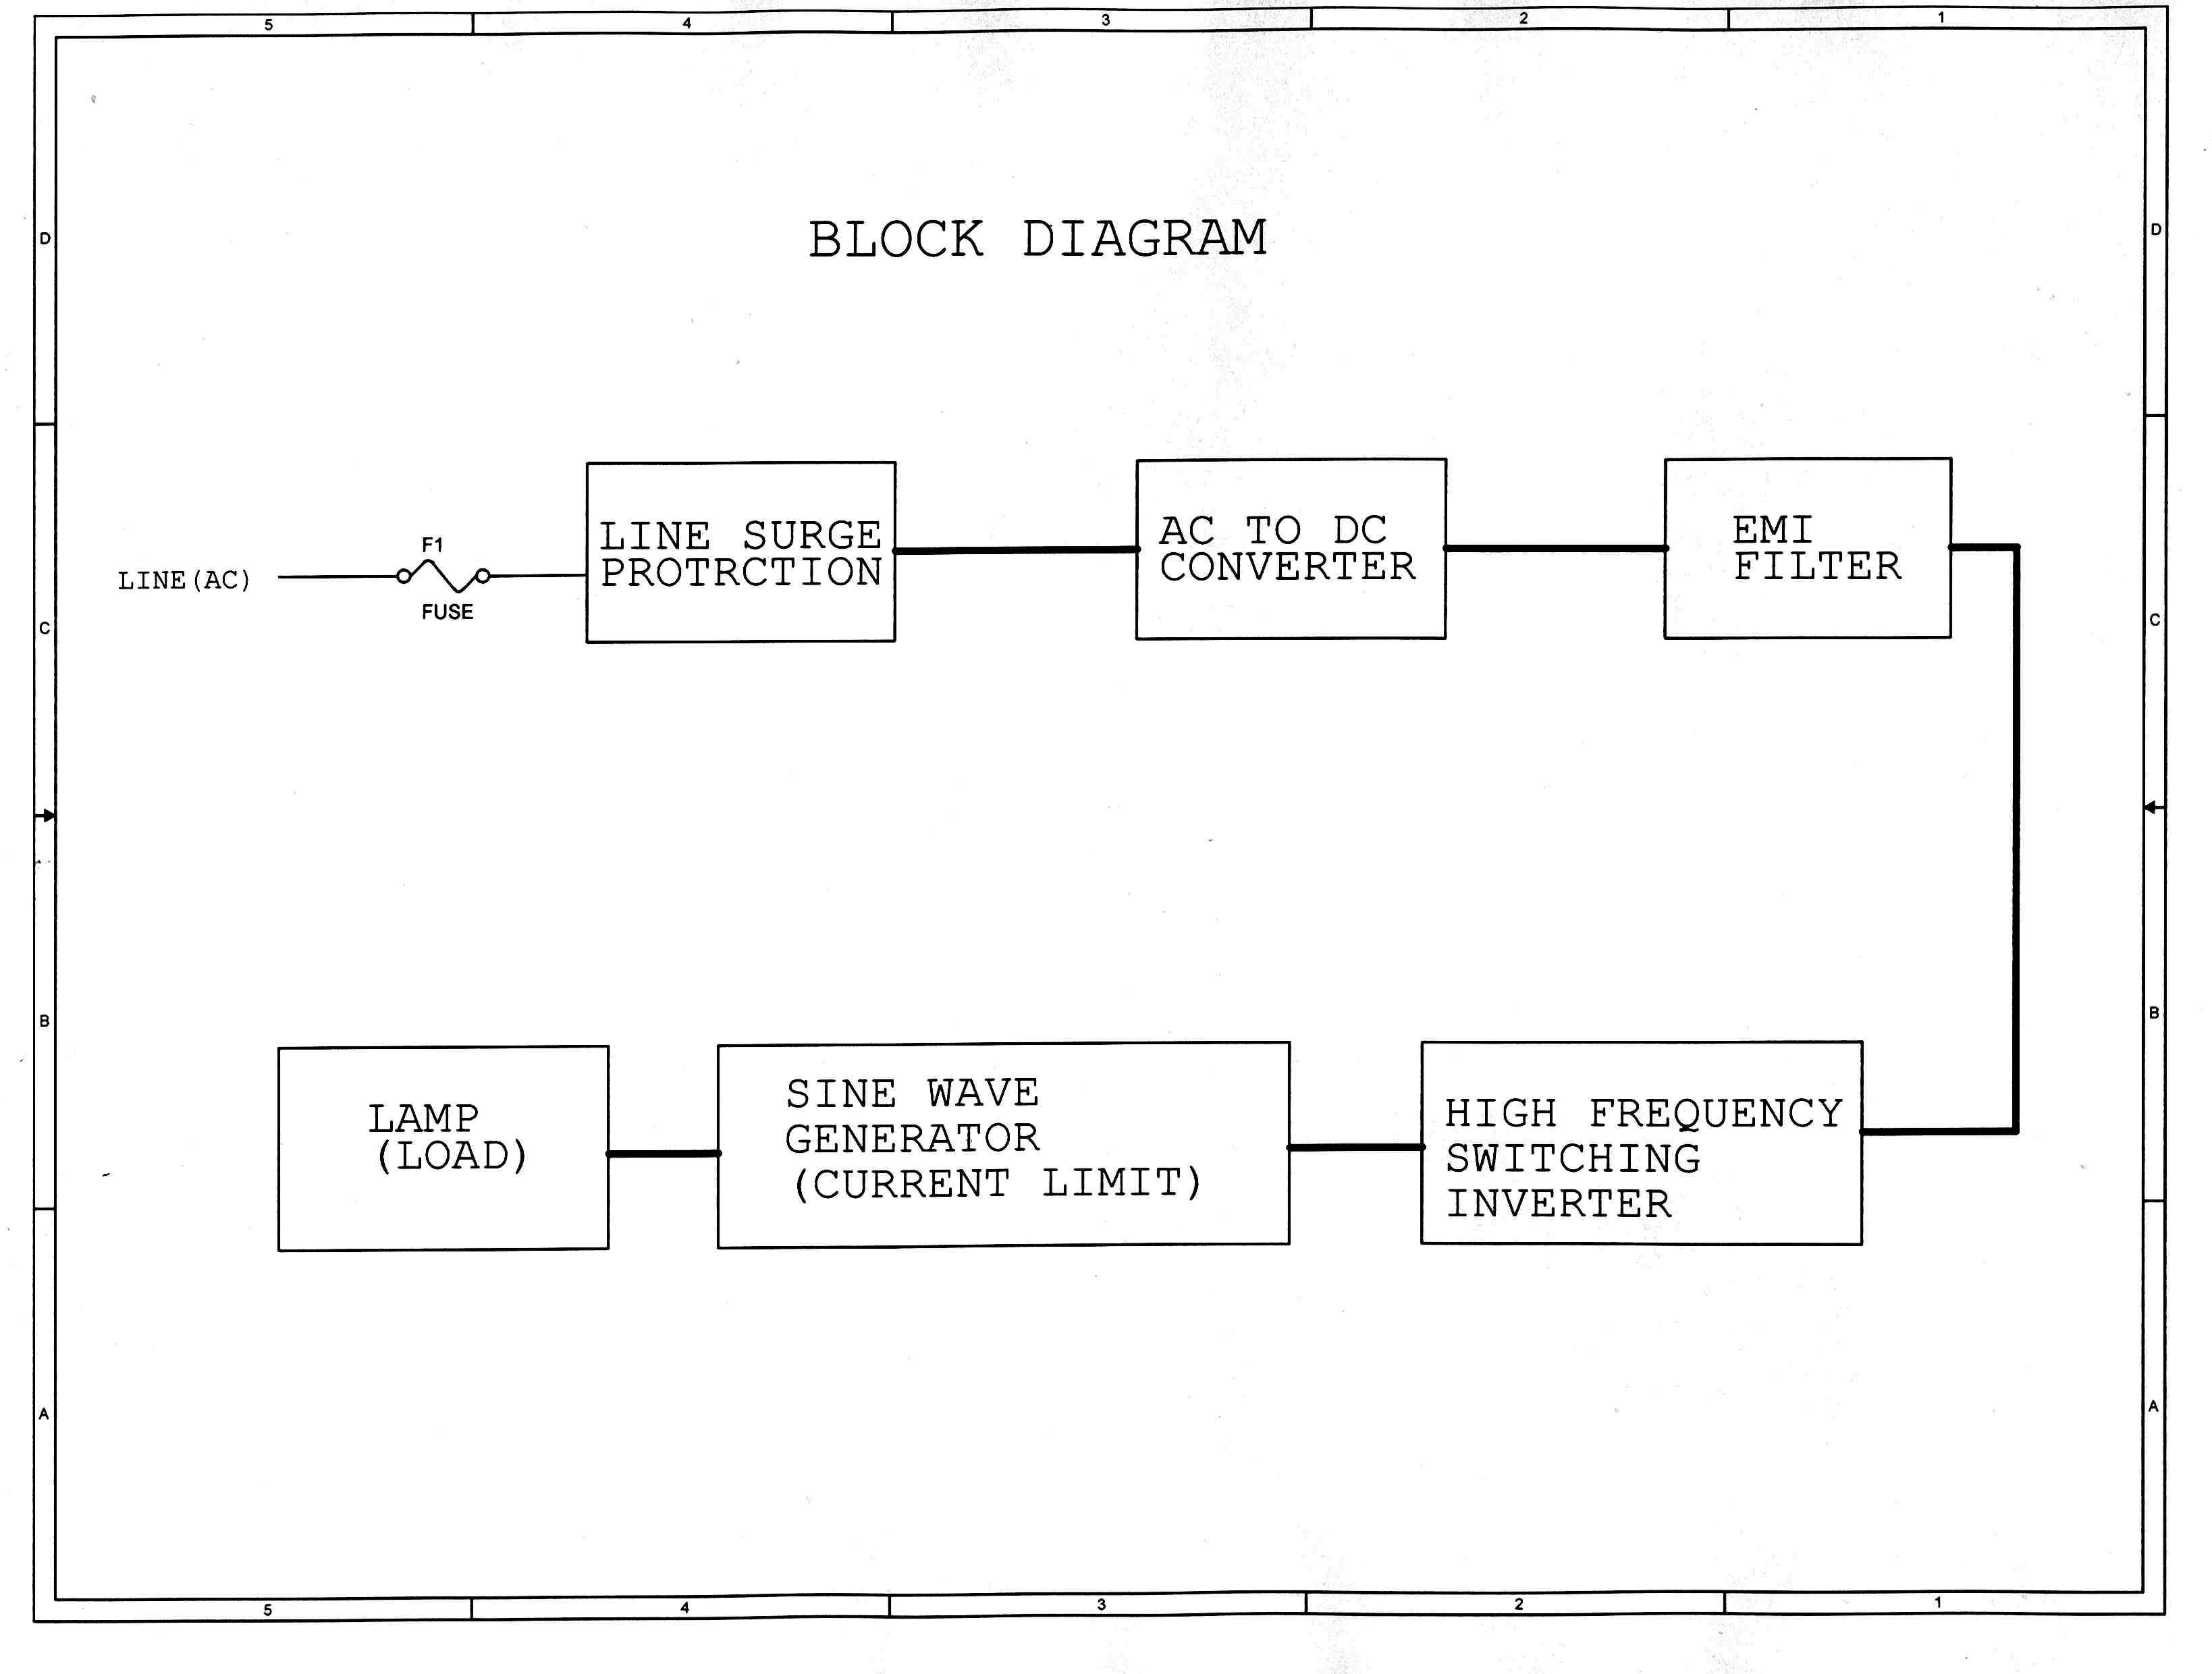
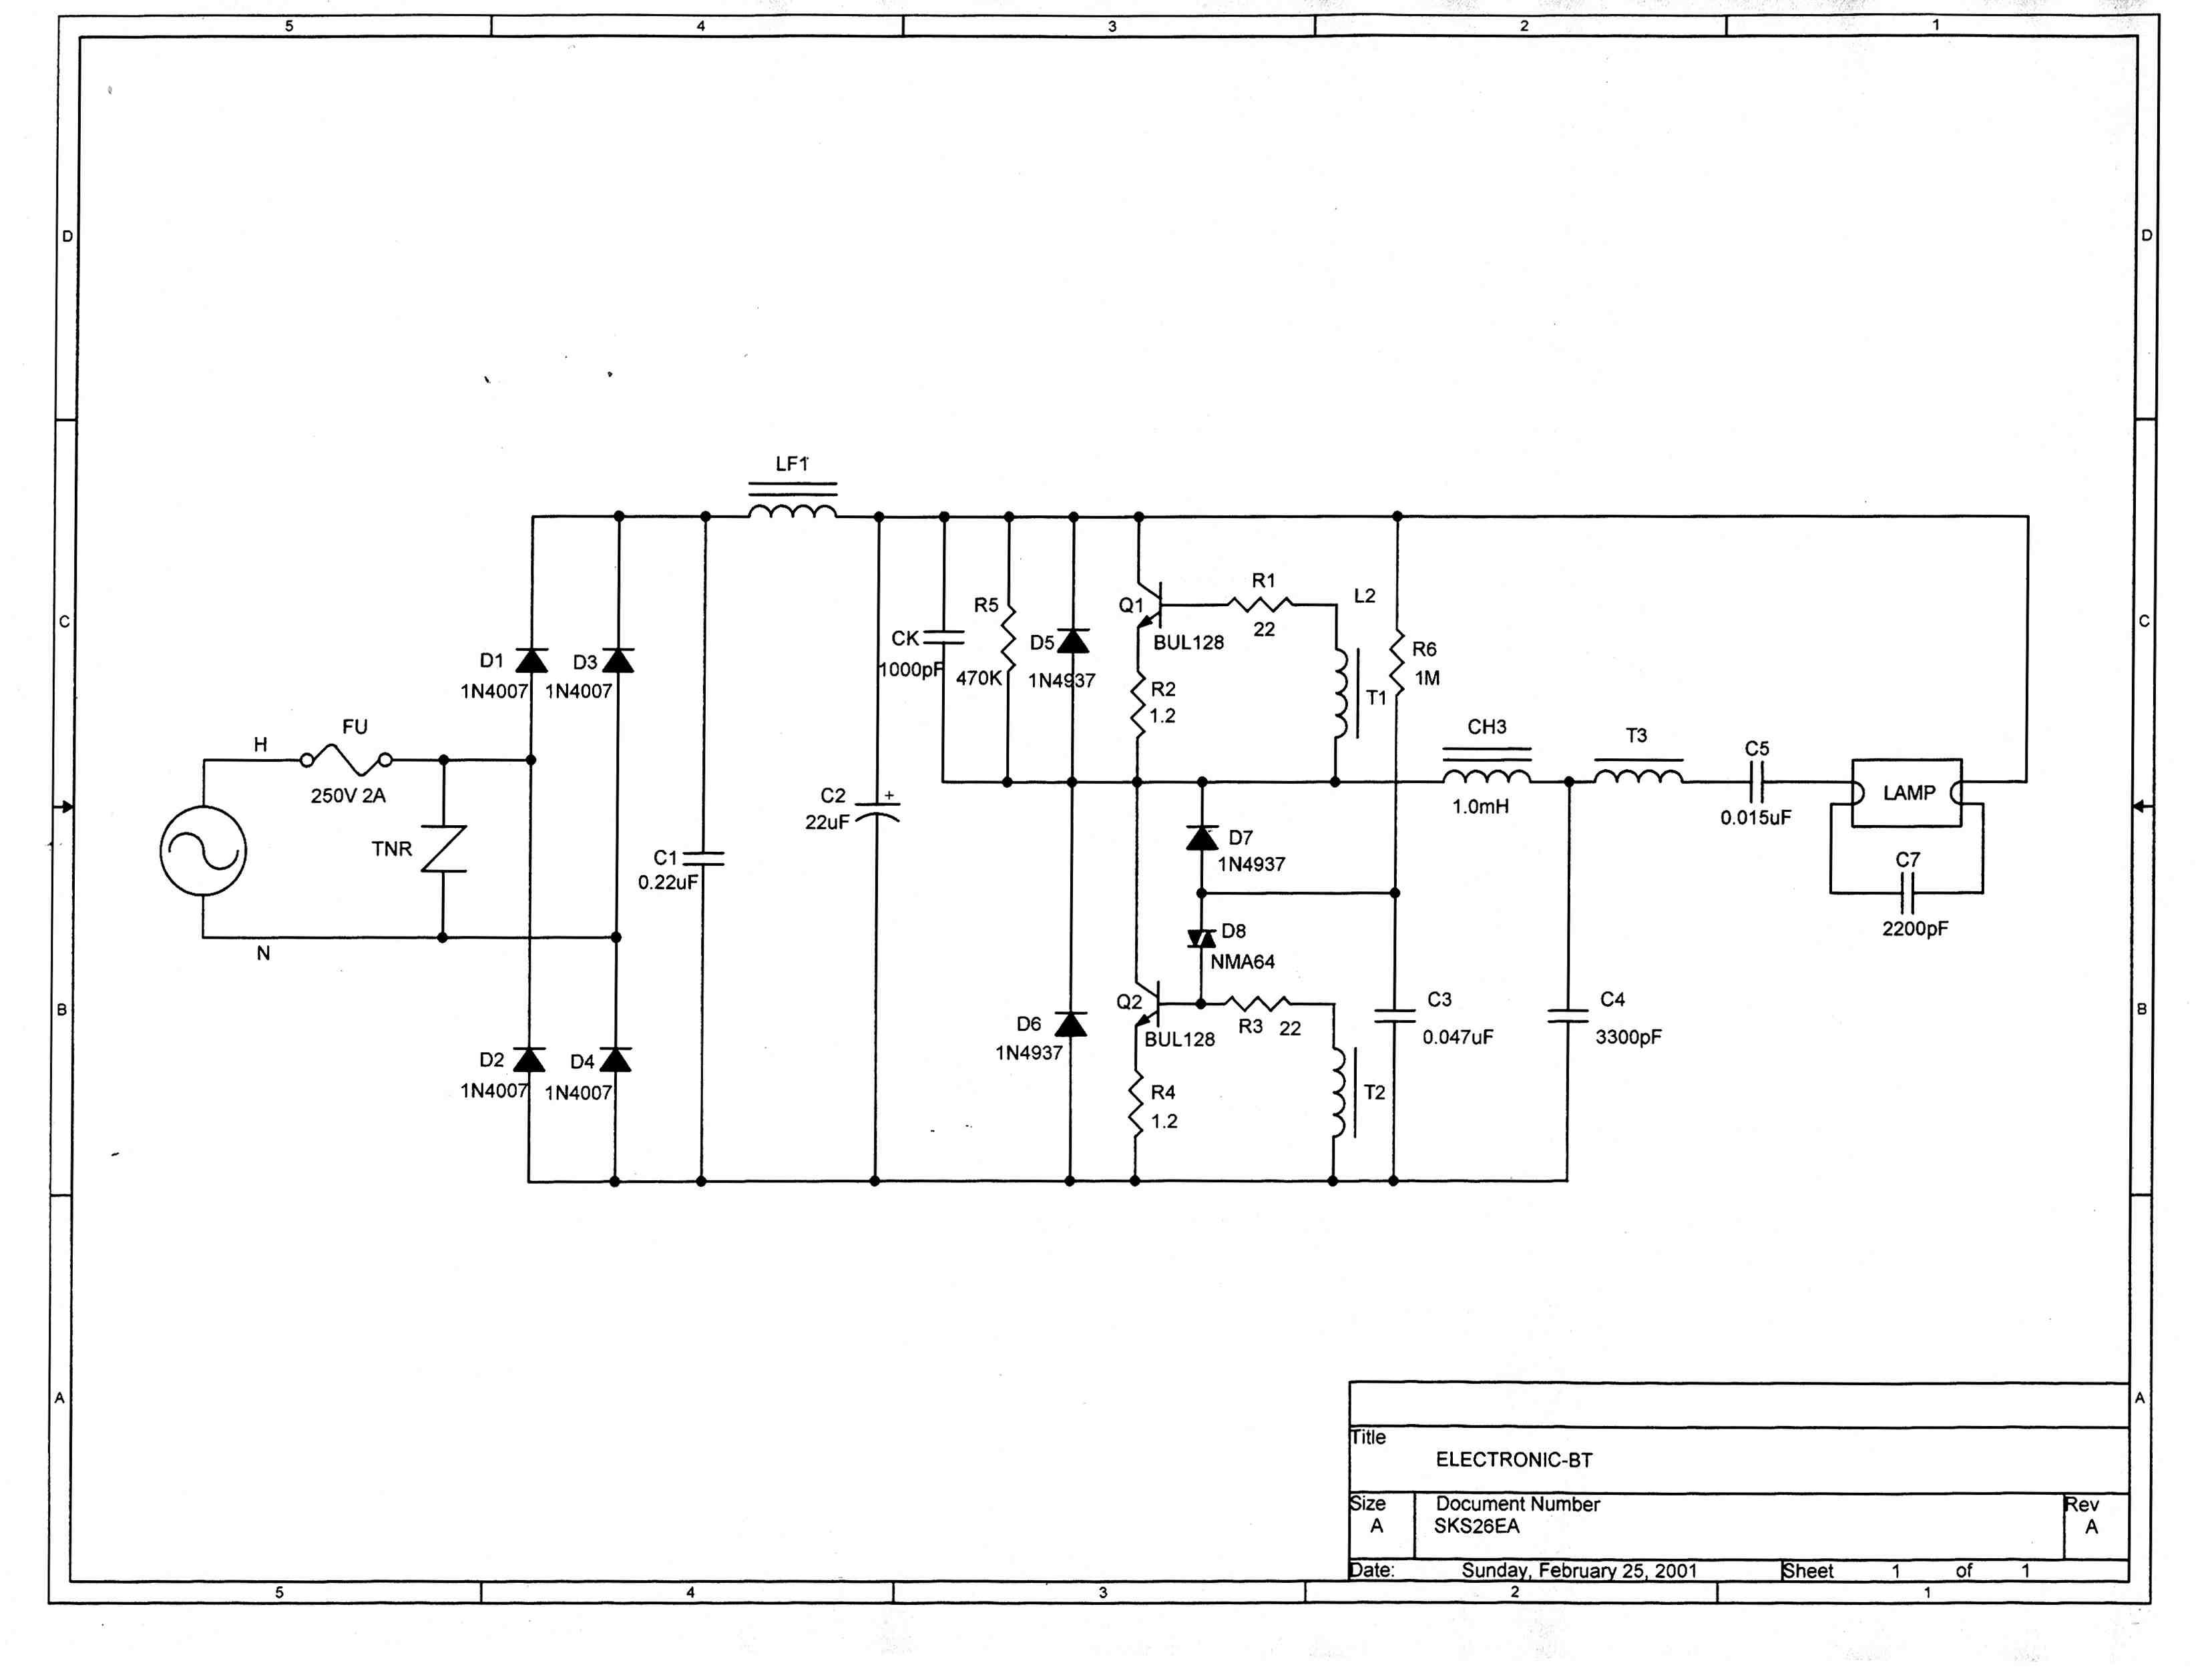
Document Text
Text extracted from the exhibit documents filed with the FCC. Open a document above to read the original.
External Photos
External Photos
ID Label/Location Info
SK S2 6 EA 2 6 W, 1 2 0 V , 6 0 H z JEE 2 6 E
Internal Photos
Internal Photos <upper side of PCB> <bottom side of PCB>
Test Report
KTL Korea Testing Laboratory Page 1 of 11 TEST REPORT This test report only responds to the tested sample and shall not be reproduced except in full without written approval of the Korea Testing Laboratory. Tested and reported by Reviewed by Jeong-Min Kim , Senior Engineer Won-Seo Cho , EMC Team Leader KOREA TESTING LABORATORY FG101-01-02-00 222-13, Guro-Dong Guro-Gu Seoul Korea 152-053 http://www.ktl.re.kr Ref. Report No. 01-341-009 Name and address of the applicant ShinKwang Enterprise Co., Ltd. 330-6, Dukji-ri, Umbong-myun, Asan-si, Chungnam-do, 336-860 Korea Standard / Test regulation FCC Part 18 Test result Pass Incoming date : February 24, 2001 Test item(s) ; RF Lighting Devices – Consumer Equipment (Electronic Ballast) Model/type ref. ; SKS26EA Manufacturer ; ShinKwang Enterprise Co., Ltd. Additional information ; -Required Authorization : Certification -FCC ID. : JEE26E Test date : February 26, 2001 Issue date : March 5, 2001 Ref. Report No. 01 - 341 – 009 2 Page of 11 TABLE OF CONTENTS I. GENERAL INFORMATION ............................................................................................................ 3 1. Grantee’s Name and Mailing Address 2. Manufacturer's Name and Mailing Address 3. Equipment Descriptions 4. Rules and Regulations 5. Measuring Procedure 6. Date of Measurement •±. CONDUCTED EMISSION MEASUREMENT (Section 18.307) ....................................................... 4-7 1. Test Procedure 2. Photograph for the test configuration 3. Sample Calculation 4. Measurement Data •≤. RADIATED EMISSION MEASUREMENT (Section 18.305) .......................................................8-10 1. Test Procedure 2. Photograph for the test configuration 3. Sample Calculation 4. Measurement Data •≥. TEST EQUIPMENTS USED FOR MEASUREMENT..................................................................11 Ref. Report No. 01 - 341 – 009 3 Page of 11 •∞. GENERAL INFORMATION 1. Grantee’s Name and : ShinKwang Enterprise Co., Ltd. Mailing Address 330-6, Dukji-ri, Umbong-myun, Asan-si, Chungnam-do, 36-860 Korea 2. Manufacturer's Name and : ShinKwang Enterprise Co., Ltd. Mailing Address 330-6, Dukji-ri, Umbong-myun, Asan-si, Chungnam-do, 36-860 Korea 3. Equipment Descriptions 3.1 Model Name : SKS26EA 3.2 Input Voltage : AC 110 V, 60 Hz 3.3 Lamp Wattage : 26 W 4. Rules and Regulations : FCC Part 18 5. Measuring Procedure : FCC / OET MP-5 (1986) 6. Date of Measurement 6.1 Conducted Emission : February 26, 2001 6.2 Radiated Emission : February 27, 2001 Ref. Report No. 01 - 341 – 009 4 Page of 11 •±. CONDUCTED EMISSION MEASUREMENT (Section 18.307) 1. Test Procedure The EUT was installed with fluorescent lamp in accordance with the manufacturer’s instruction and operated in a manner that is the representative of the typical usage for equipment. Conducted emission measurements on the EUT were performed by "Conducted Powerline Measurement" procedure as per MP-5. The EUT was set up on a wooden table 0.4 meters height, 1.0 by 1.5 meters in size, placed in the shielded enclosed with a side of wall of which constituted a vertical conducting surface of 2.2 m x 3.1 m in size to maintain 0.8 meters from the rear of EUT LISN's(Line Impedance Stabilization Network, EMCO, 3825/2, 50 ohm / 50 μH) were installed and electrically boned to the conducting ground plane. The EUT was connected to the LISN. One of two 50 ohm output terminals of the LISN was connected to the Spectrum Analyzer(HP, 8566B, 10 kHz to 22 GHz) with the Quasi-Peak Adapter (HP, 85650A, 10 kHz to 1.0 GHz) and the other was terminated in 50 ohms. Measurements were again performed after interchanging such a connection oppositely. The frequency range from 450 kHz to 30 MHz was examined and the peak values that are within 6 dB of the limit would be compared to quasi-peak values using the Quasi-Peak instrument (ROHDE & SCHWARZ, ESH3, 9 kHz to 30 MHz : Detector Function CISPR Quasi-Peak) or HP Quasi-Peak adapter(85650A, 10 kHz to 1.0 GHz) The voltage developed across the 50 ohms port in LISN was measured by the Spectrum Analyzer and graphed by the Plotter(HP, 7470A). The 6 dB bandwidth of the Spectrum Analyzer and Quasi-Peak Adapter was set to 9 kHz with no post detector video filter. The position of connecting cables of the EUT was changed to find the worst case configuration during measurements. The maximum emission level from the EUT occurred in such configuration as shown in the following photograph. Ref. Report No. 01 - 341 – 009 5 Page of 11 2. Photograph for the test configuration 3. Sample Calculation The emission level measured in decibels above one microvolt (dBß≈) was converted into microvolt (ß≈) as shown in following sample calculation. For example : Measured Value at 0.54 MHz 44.9 dB ß≈ + Cable Losses * 0.0 dB ---------------------------------------------------------------------- = Conducted Emission 44.9 dBß≈ ( = 175.8 ß≈ ) * In case of RG214/ RF cable 15 Ft, the loss is about 0.17 dB at the frequency of 30 MHz which is negligible. Ref. Report No. 01 - 341 – 009 6 Page of 11 4. Measurement Data - Resolution Bandwidth : x Peak (6dB Bandwidth : 9kHz) x CISPR Quasi-Peak (6dB Bandwidth : 9kHz) Measured Value Emission Level Power Lead Tested Frequency (MHz) Peak (dBß≈) Q-Peak (dBß≈) (dBß≈) (ß≈) Limit (ß≈) (*) Margin (dB) 0.48 48.8 42.7 42.7 136.5 250 - 5.3 0.53 49.1 44.0 44.0 158.5 250 - 4.0 0.59 46.5 41.4 41.4 117.5 250 - 6.6 0.71 46.8 42.0 42.0 125.9 250 - 6.0 0.77 48.5 42.6 42.6 134.9 250 - 5.4 0.83 45.9 40.2 40.2 102.3 250 - 7.8 Live to Ground 1.01 44.2 38.6 38.6 85.1 250 - 9.4 0.49 49.9 42.8 42.8 138.0 250 - 5.2 0.54 50.3 44.9 44.9 175.8 250 - 3.1 0.60 50.7 45.5 45.5 188.4 250 - 2.5 0.66 48.3 42.9 42.9 139.6 250 - 5.1 0.84 48.1 43.0 43.0 141.3 250 - 5.0 0.99 45.9 40.5 40.5 105.9 250 - 7.5 Neutral to Ground 1.10 43.5 37.6 37.6 75.9 250 -10.4 Note : The noise floor level of the spectrum analyzer was observed in 22dBß≈. Refer to measured graphs on next page. * Margin(dB) : Emission Level (dB) - Limit (dB) Ref. Report No. …
Text truncated - open the document above for the full version.
Contact Information
Applicant
Houn-Gu Cho(Deputy General Manager)
Test Firm
Korea Testing LaboratoryJeong-Min Kim
Technical Specifications
| # | Rule Parts | Frequency Range | Power Output |
|---|---|---|---|
| 1 | 18 | 0.045 MHz - 0.05 MHz | - |
Other Applications from Shinkwang Enterprise Co Ltd
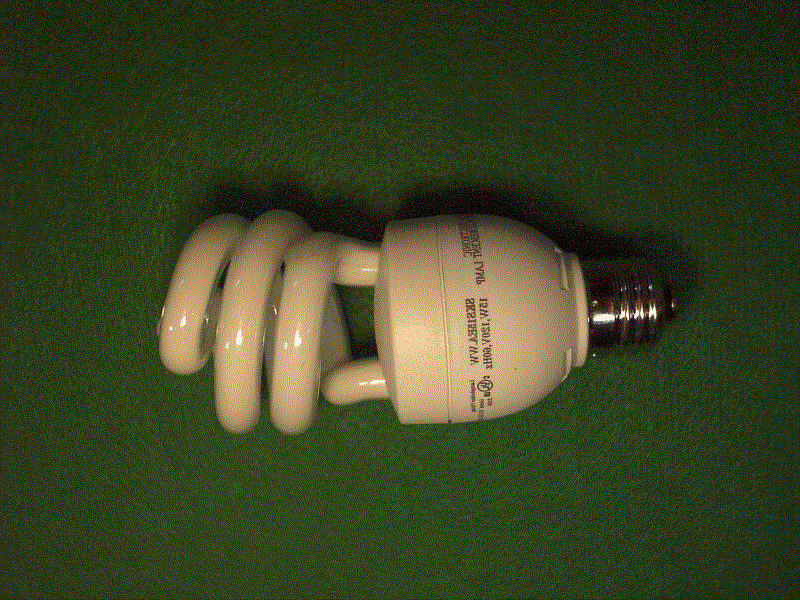
JEE15E
Apr 08, 2001Electronic Ballast
Equipment Class
8CC - Part 18 Consumer Device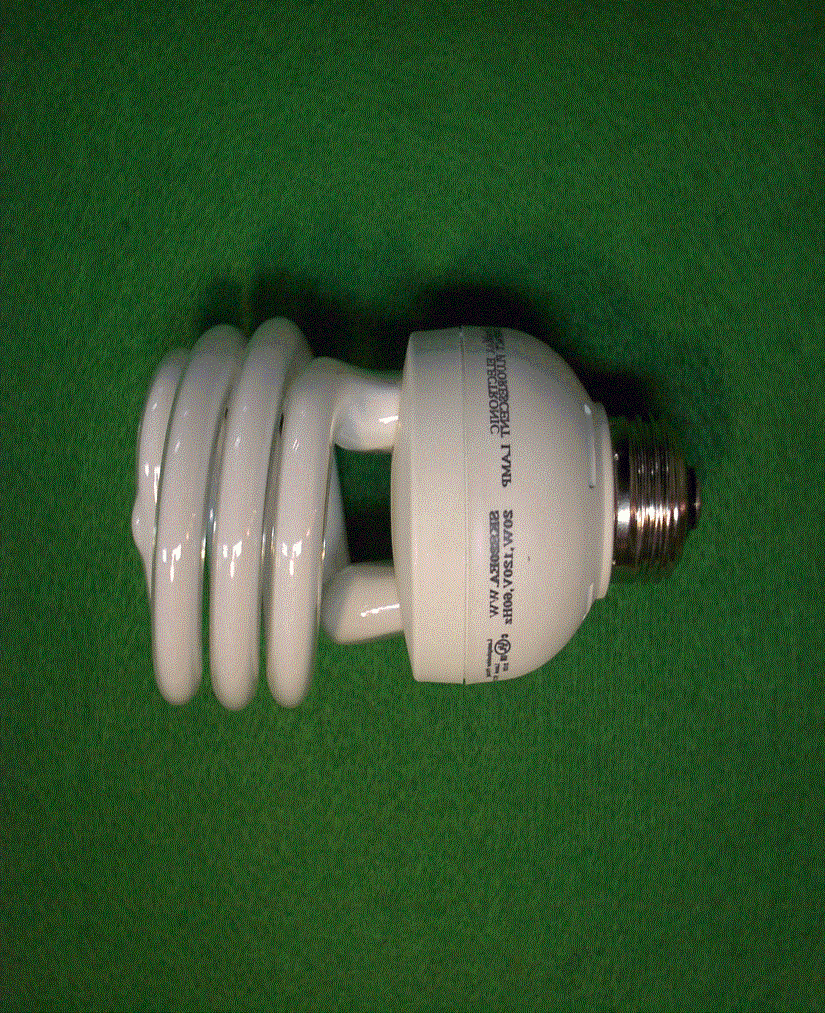
JEE20E
Apr 08, 2001Electronic Ballast
Equipment Class
8CC - Part 18 Consumer DeviceJEE315EH
Aug 30, 1995RF lighting device
Equipment Class
8CC - Part 18 Consumer DeviceJEE323EH
Jun 26, 1994RF Lamp
Equipment Class
8CC - Part 18 Consumer DeviceJEE318ER
Feb 06, 1994RF Lamp
Equipment Class
8CC - Part 18 Consumer Device