Q5ZQUPID2003QUick reaction Perimeter Intrusion Detection
Curtiss Wright/Vista Controls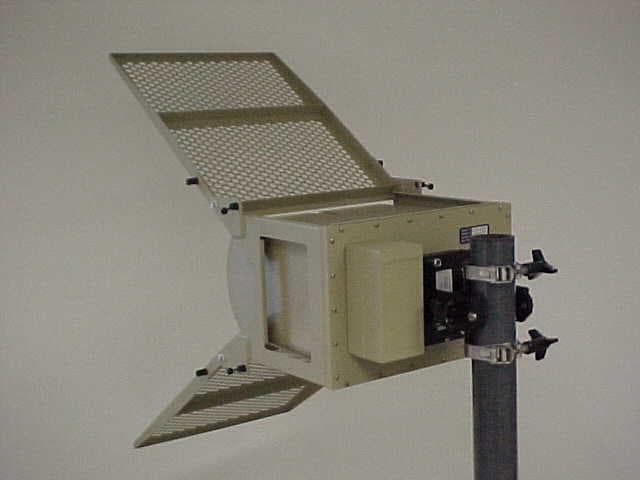
Click to zoom
Application Details
- Equipment Class
- UWB - Ultra Wideband Transmitter
- Date of Grant
- Apr 17, 2007
- Application Purpose
- Original Equipment
- Date of Application
- Jul 15, 2003
- Equipment Note
- QUick reaction Perimeter Intrusion Detection
- Frequency Range
- 2094.00000000 - 3116.00000000
- Country
- United States
Documents & Files
Document Text
Text extracted from the exhibit documents filed with the FCC. Open a document above to read the original.
Users Manual
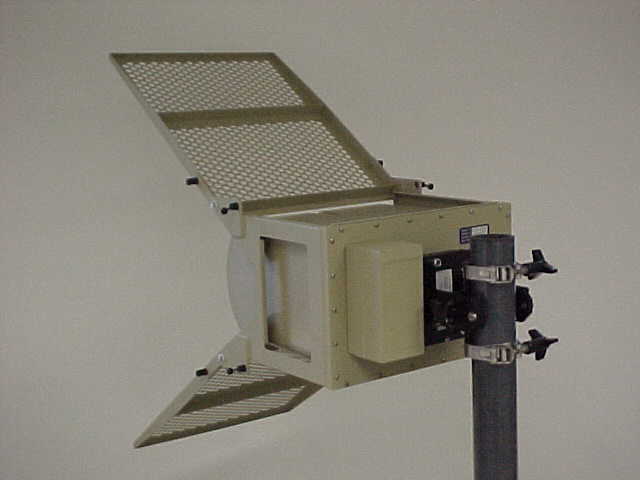
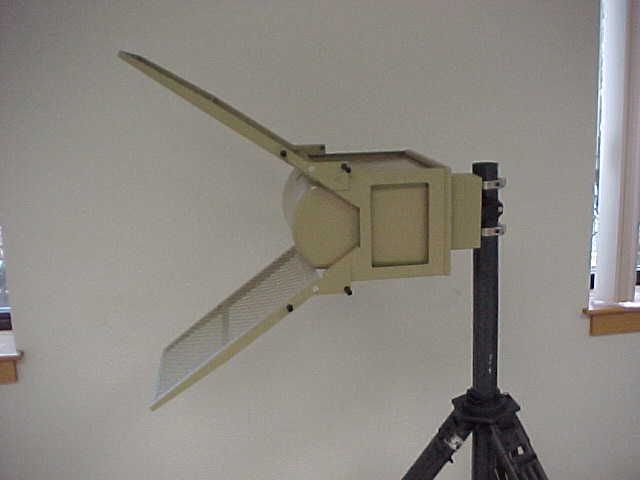
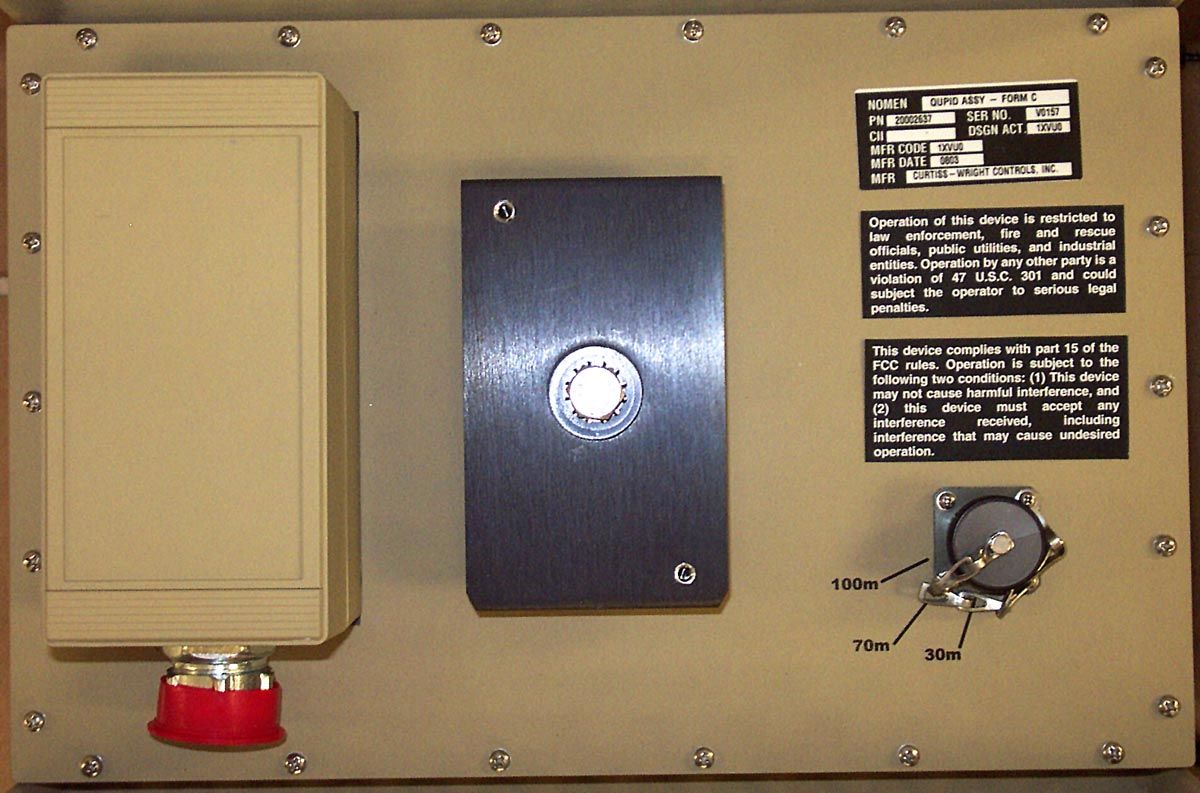
This document contains proprietary information, and except with the written permission from Curtiss Wright Flight Systems, such information shall not be published, or disclosed to others; and the document shall not be duplicated in whole or in part. Quick Reaction Perimeter Intrusion Detection Sensor (QUPID – Form C) Installation and Users Manual 14 JUNE 2002 REVISION 2 The information contained herein is proprietary REVISION 2 information subject to the restrictions stated on the front page i QUPID INSTALATION AND USERS MANUAL Chapter Page 1. Overview............................................................... 1 2. Components........................................................... 2 3. Installation Procedures............................................. 3 4. Mounting and Setup................................................. 6 5. Constraints and Limitations....................................... 9 6. Maintenance and Troubleshooting............................... 17 Figures 1-1 QUPID Range Gate Detection Pattern.......................... 1 3-1 QUPID Sensor and Folding Antenna Reflector.............. 3 3-2 Deploy Antenna Reflectors....................................... 3 3-3 Adjust Range Settings............................................. 4 3-4 Interface Box......................................................... 4 3-5 Interface Box Wiring............................................... 5 3-6 Wiring Schematic................................................... 5 4-1 Sensor Mounting.................................................... 6 4-2 Power/Alarm Cable Routing..................................... 7 4-3 QUPID Sensor Detection Test.................................... 8 5-1 Range Gate and Clearance Positions........................... 10 5-2 Spacing Between Sensors.......................................... 12 5-3 Sensor Spacing vs. Angle Overlap................................ 13 5-4 Example of deployment of 4 sensors at 90 o corner............ 15 Tables 5-1 Range Settings and Clearance Radius............................ 11 5-2 Spacing Between Sensors........................................... 12 5-3 Linear Dimension To A Fence Line.............................. 13 5-4 Maximum QUPID sensor to sensor spacing.................... 14 5-5 Wire table for single sensor power run.......................... 16 5-6 Range Setting and Target Detection............................. 16 Table of Contents The information contained herein is proprietary REVISION 2 information subject to the restrictions stated on the front page. - 1 - 1.0 OVERVIEW 1.1 The QUPID sensor is a rapidly deployable, easily transportable and quickly relocatable security sensor for a variety of applications. This sensor utilizes Ultra Wide Band radar technology operating in the “S” band (2.0 to 2.4 GHz), with a very low average transmit power output of less than 5 milliwatts. The sensor is used to detect intrusion towards a protected area or asset, prior to the intruder reaching the perimeter. In this application, the sensor performs as a “beyond the fence” perimeter intrusion detection device. 1.2 The general detection zones for a nominal range of 100 meters is illustrated below in Figure 1-1. As shown in this figure, the basic detection pattern is a 90 o semi-circular arc with an alarm radius of 100 meters. Note that in addition to 100 meters, ranges of either 70 or 30 meters can also be selected. QUPID will indicate an intrusion by detection of an intruder sequentially passing through range gates A, B and then C (the alarm range setting). Figure 1-1 QUPID Range Gate Detection Pattern (100 Meter Example) 1.3 The span of coverage of the sensor is defined here as the linear distance (chord) to the +/- 45° points. This is also the maximum distance between a line of sensors to ensure overlapping coverage. The sensor range and the fixed sensor angle of coverage of +/- 45° about the centerline determines this distance. For the 100 meter case illustrated, the span of coverage is 112 meters. NOTE: Details for detection zone as a function of range setting is given in Section 5.0, under Constraints and Limitations. Range gates: (ALARM) A B C 45° Ri ght Fence Example: 100 meter range and 90 o azimuth shown. Drawing is not to scale and is for illustrative purposes only. Range = 100 m Span – 112 m The information contained herein is proprietary REVISION 2 information subject to the restrictions stated on the front page. - 2 - 2.0 COMPONENTS The following components are required to establish one (1) detection zone with QUPID. 1. Universal Mounting Bracket (UMB). 2. QUPID sensor with attached UMB mounting plate and auxiliary antenna reflectors. 3. Other miscellaneous items required for installation and setup: • #2 Phillips screwdriver • Flat blade screwdriver • Compass The information contained herein is proprietary REVISION 2 information subject to the restrictions stated on the front page. - 3 - 3.0 INSTALLATION PROCEDURES Unpack sensor with attached antenna reflector and place on clean surface as shown in Figure 3-1. Figure 3-1 QUPID Sensor and Folded Antenna Reflector 3.1 Unscrew the captive thumb screws (Figure 3-1, Item 1), one on each side of each antenna reflector, until the spring on the screw pushes the screw clear of the threaded hole. 3.2 Carefully unfold antenna reflectors as shown in Figure 3-2, Item 1. At approximately a 30° angle, the mating threaded holes and the thumb screws on the side angle support will align. Push in on the spring loaded thumb screws, Figure 3-2, Item 2, located on both sides of each antenna reflector, and tighten. Figure 3-2 Deploy Antenna Reflectors 1 1 1 1 2 The information contained herein is proprietary REVISION 2 information subject to the restrictions stated on the front page. - 4 - 3.3 Range Adjustment: Unscrew the protective cap (Figure 3-3, Item 1). Using a flat blade screwdriver, adjust the range setting to the desired value (30, 70, 100 meters) NOTE: The range setting has three “click” p…
Text truncated - open the document above for the full version.
Attestation Statements
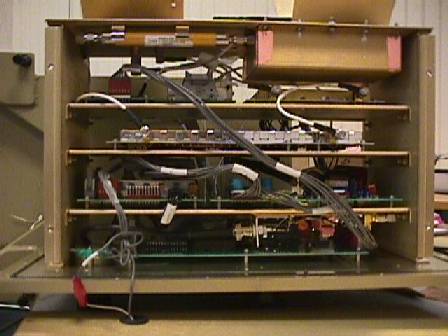
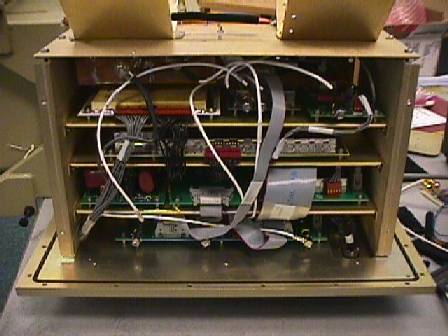
Date: August 22, 2003 Subject: Response to Correspondence # 25596 From: David Masucci To: Joe Dichoso FCC ID: Q5ZQUPID2003 This memorandum is in response to the FCC Correspondence Letter, Reference # 25596. This memorandum will provide responses to each question in the same order as presented in the initial correspondence. Questions 1 through 4, and 6 through 8 will be answered in-full at this time. Questions 5, 9, and 10 will require some additional radiated measurements to be made. A separate response generated at a later date will fulfill that requirement. 1) A block diagram that includes all oscillators has been uploaded as an exhibit. 2) Yes Vista Controls requires that only the block diagram and schematics be held as confidential. The general Theory of Operations is available as public domain information under U.S. Patent Number 6,208,248. Major exceptions to the patent are that the QUPID PRF is approximately 2.441 KHz, and the PN dither percentage is approximately 6.2%. It is for this reason that Vista Controls does not require that the Theory of Operations be held as confidential. 3) Photographs of all circuit card assemblies and of the antenna assembly have been uploaded as exhibits. 4) Photographs of the product with both FCC labels affixed in their final locations have been uploaded as exhibits. 5) TBD 6) Yes as part of the Waiver process, the GPS report was provided with the submission for authorization as requested by Mr. John Green of the FCC’s Office of Engineering and Technology. Vista Controls has observed that prior GPS testing did not go down to very low PRF’s such as is used in the QUPID sensor. QUPID’s PRF is more than 400 (four hundred) times lower than the 1 MHz “low” PRF commonly used for UWB interference testing. Our testing indicated no perceptible interference from the QUPID product. 7) Yes the CP note on form 731 should not have been included. 8) Vista Controls erroneously included this frequency in the Narrowband Radiated Emissions Results table # 6. It should be noted however that the -53.3 dBm EIRP limit equates to a value of 41.96 dBuV/m at 3 meters. Even using the quasi-peak number which will be a higher value than if measured using the required RMS, the unit passes this requirement with a 3 meter reading of 41.00 dBuV/m. If measured using an RMS detector (or alternately using the Appendix F method), the result would show greater margin. If the above explanation is not acceptable, Vista Controls will schedule a retest per your requirements of this section. 9) TBD 10) TBD
Attestation Statements
Date: September 10, 2003 Subject: Continuation and completion of Response to Correspondence # 25596 From: David Masucci To: Joe Dichoso FCC ID: Q5ZQUPID2003 This memorandum is a completion of the partial response dated August 22, 2003, to your FCC Correspondence Letter, Reference # 25596. This memorandum will provide responses to questions numbered 5, 9, and 10 of the original reference letter. The data in the following paragraphs was taken per the guidelines in Appendix F of the Part 15 rules. All scans were performed at 3 meters in an anechoic (outdoor) environment. All measurements are above 1 GHz and were taken with an EMCO Model 3115 1-18 GHz Double-Ridged Waveguide Horn antenna. Data was recorded manually from an HP 8592 Spectrum Analyzer. The data was then entered into an Excel spreadsheet that performed the calculations as defined in the most recent FCC correspondence # 25677. The spreadsheet also performs the conversion to EIRP, and provides the final result in dBm. A separate spreadsheet is provided for each RMS average measurement described below. 5) Emissions levels in the GPS bands were measured using the method described in Appendix F of the Part 15 Rules. First the analyzer was set to a peak detect mode, and the span was set to observe the entire GPS band from 960 to 1610 MHz. A photo is attached. The area of highest emissions was noted. The analyzer was then set as follows: RBW = 1 MHz, VBW = 1 MHz, sweep 15mS (fastest available), detector = sampled, span = 0 Hz. The analyzer was configured for single sweep operation. The frequency was set to the highest peak at 1.2192 GHz. A single sweep was initiated, and then a peak search was performed. That value was recorded as sample #1. The “next peak” button was pressed and the level recorded for each successive sample, until the 10 highest samples were recorded. A second single sweep was performed, and then 10 more samples starting from the highest were again recorded. This process was repeated until there was a total of 10 sweeps completed, each with 10 samples recorded. For the GPS band, the measured RMS Average value was -54.89 dBm EIRP. Please note this number is in compliance with the current Part 15 UWB limits for the GPS band. The same process was repeated for the upper band from 1610 to 1990 MHz. The analyzer was set to a peak detect mode, and the span was set to observe the entire band. In this case the highest emission was centered at 1.9862 GHz. For this band, the measured RMS Average value was -55.17 dBm EIRP. Please note this number is in compliance with the current Part 15 UWB limits for this band. 9) We have reviewed the data presented in the EMC report for peak level. Figure 14 shown on page 20 is from a scan taken at the NTS test Facility. The scan is of the main lobe of the QUPID transmitter. It was taken with a peak detector, and a resolution/video bandwidth of 1 MHz. The peak reading is 100dBuV/m at a measurement distance of 3 meters. This plot is corrected for measurement distance, cable loss, and antenna gain. To convert dBuV/m to dBm, we use the following formula: 100dBuV + 20Log(3) – 104.8 = +4.7 dBm. Conversion from the 1 MHz bandwidth to a 50 MHz bandwidth we use the FCC mandated 20Log of the bandwidth ratio, which yields a correction of +34dB. +4.7 dBm + 34 dB = +38.7 dBm. This process is reflected in the table 9 results on page 23 of the report. This measurement is as defined in Appendix F, measurement procedure #6. This data corresponds with the value quoted in the waiver requests. 10) RMS Average levels for the main lobe of UWB emissions were measured using the method described in Appendix F of the Part 15 Rules. First the analyzer was set to a peak detect mode, and the span was set to observe the band from 2 to 2.9 GHz. It is in this band that the peak of the emissions occurs. A photo is attached. The area of highest emissions was noted as 2.38 GHz. The analyzer was then set as follows: RBW = 1 MHz, VBW = 1 MHz, sweep 15mS (fastest available), detector = sampled, span = 0 Hz. The analyzer was configured for single sweep operation. The frequency was set to 2.3864 GHz. A single sweep was initiated, and then a peak search was performed. That value was recorded as sample #1. The “next peak” button was pressed and the level recorded for each successive sample, until the 10 highest samples were recorded. A second single sweep was performed, and then 10 more samples starting from the highest were again recorded. This process was repeated until there was a total of 10 sweeps completed, each with 10 samples recorded. The measured RMS Average value was -27.48 dBm EIRP. Additional data included below: 1) Excel spreadsheet with In-band RMS avg. data 2) Excel spreadsheet with GPS band RMS avg. data 3) Excel spreadsheet with 1610 to 1990 MHz RMS avg. data 4) Spectrum analyzer photo of in-band sweep for (1) above 5) Spectrum analyzer photo of 960 to 1610MHz sweep for (2) above 6) Spectrum analyzer photo of 1610 to 1990 MHz sweep for (3) above APPENDIX F RMS AVERAGE / 10 SWEEPS / 10 SAMPLES / INBANDCentered at 2.38GHz 10 dB Attenuator Sweep 1Sweep 2Sweep 3Sweep 4Sweep 5 7.03E-084.942E-154.71E-072.218E-136.70E-074.489E-133.80E-081.444E-155.91E-073E-13 3.46E-101.197E-196.90E-084.761E-156.90E-094.761E-175.00E-092.5E-178.60E-097E-17 1.04E-101.082E-205.30E-082.809E-154.30E-091.849E-173.80E-091.444E-177.70E-116E-21 1.03E-101.061E-203.80E-091.444E-171.50E-092.25E-183.20E-091.024E-177.60E-116E-219.33164E-08 W RMS Avg 1.01E-101.02E-206.81E-104.638E-199.20E-118.464E-212.89E-108.352E-207.40E-115E-21 At the Antenna 9.60E-119.216E-215.77E-103.329E-198.70E-117.569E-211.66E-102.756E-206.80E-115E-21 9.00E-118.1E-211.04E-101.082E-208.00E-116.4E-219.80E-119.604E-216.70E-114E-21-70.30 dBm RMS Avg 8.70E-117.569E-217.60E-115.776E-217.90E-116.241E-219.20E-118.464E-216.60E-114E-21 At the Antenna 8.00E-116.4E-217.60E-115.776E-217.80E-116.084E-218.70E-117.569E-216.60E-114E-21 7.30E-115.329E-217.00E-114.9E-217.80E-116.084E-218.20E-116.724E…
Text truncated - open the document above for the full version.
Attestation Statements
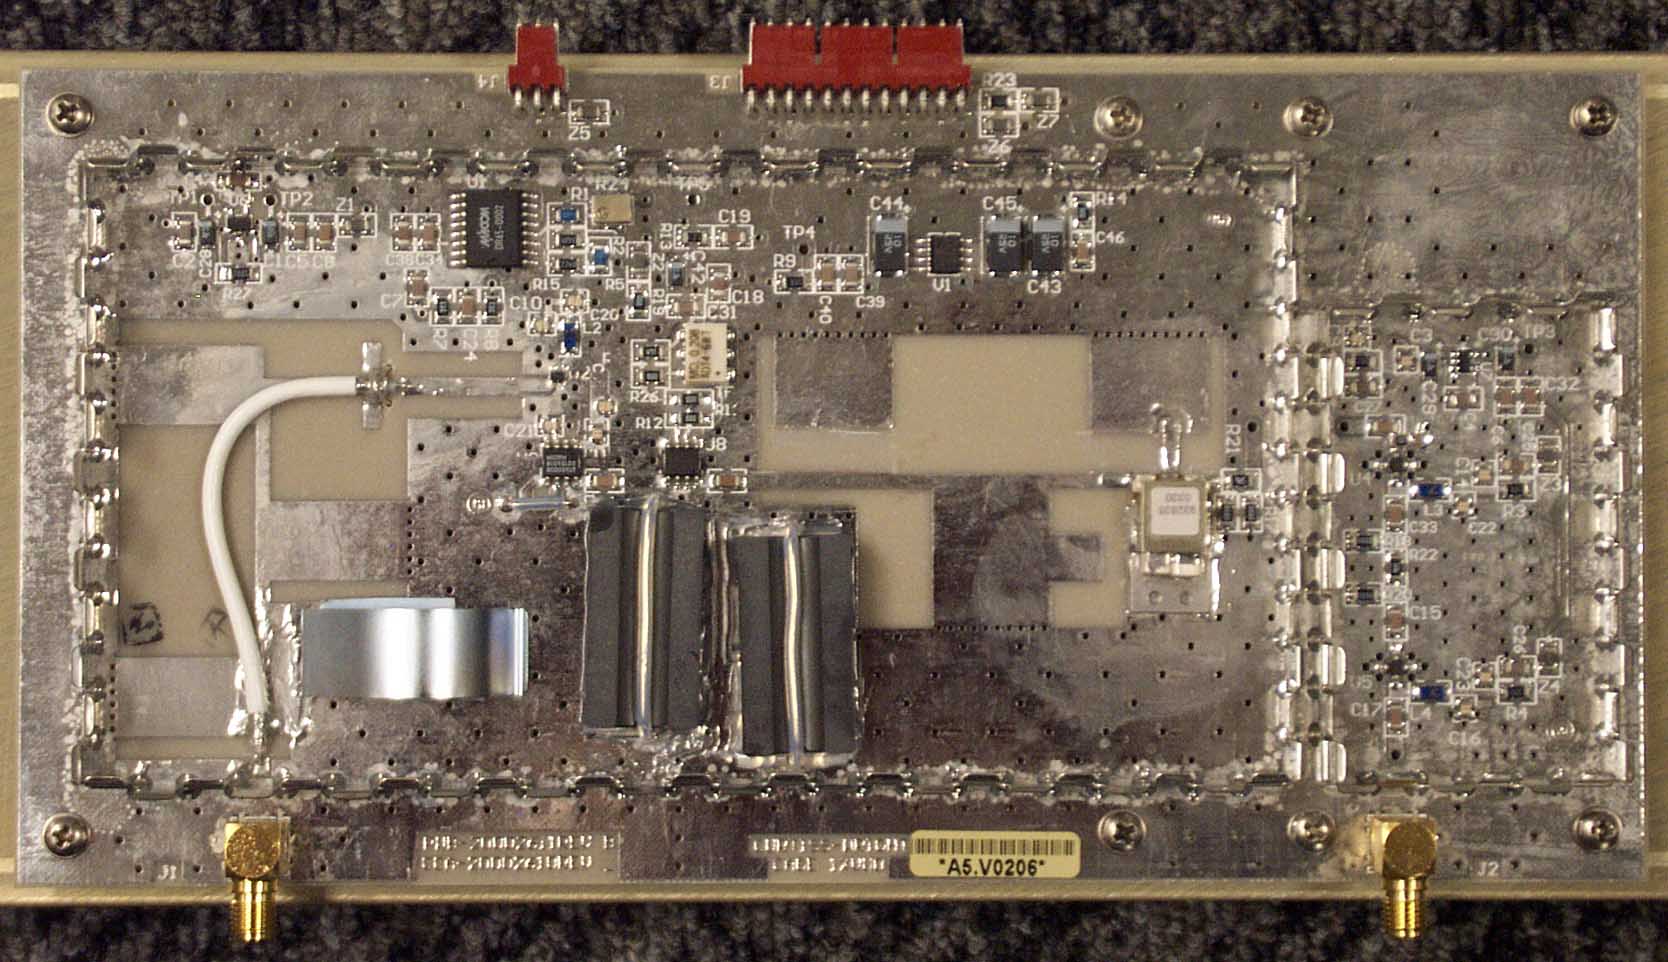
Date: September 11, 2003 Subject: Response to Correspondence # 25677 From: David Masucci To: Joe Dichoso FCC ID: Q5ZQUPID2003 This memorandum is in response to your FCC Correspondence Letter, Reference # 25677. This memorandum will provide responses to questions numbered 1 & 4 of the original reference letter. Other questions which were repeated from the previous correspondence # 25596 were previously answered. 1) Improved photograph of the component side of the preamplifier board. This is attached below. A separate jpeg version will be uploaded with this document. 2) The data in the following paragraph was taken per the guidelines in Appendix F of the Part 15 rules. A scan was performed at 3 meters in an anechoic (outdoor) environment. Measurements were taken with an EMCO Model 3115 1-18 GHz Double-Ridged Waveguide Horn antenna. Data was recorded manually from an HP 8592 Spectrum Analyzer. The data was then entered into an Excel spreadsheet that performed the calculations as defined in the most recent FCC correspondence # 25677. The spreadsheet also performs the conversion to EIRP, and provides the final result in dBm. This is in response to the question of measurement at 1000 MHz. First the analyzer was set to a peak detect mode, and the span was set to observe the spectrum from 960 to 1010MHz. No significant peak was found, just a flat noise floor was observed. The analyzer frequency was centered on 1000 MHz. The analyzer was then set as follows: RBW = 1 MHz, VBW = 1 MHz, sweep 15mS (fastest available), detector = sampled, span = 0 Hz. The analyzer was configured for single sweep operation. A single sweep was initiated, and then a peak search was performed. That value was recorded as sample #1. The “next peak” button was pressed and the level recorded for each successive sample, until the 10 highest samples were recorded. A second single sweep was performed, and then 10 more samples starting from the highest were again recorded. This process was repeated until there was a total of 10 sweeps completed, each with 10 samples recorded. For the 1000MHz data point, the measured RMS Average value was -60.07 dBm EIRP. Please note this number is in compliance with the current Part 15 UWB limits for this band. APPENDIX F RMS AVERAGE / 10 SWEEPS / 10 SAMPLES / 1GHzCentered at 1GHz 10 dB Attenuator Sweep 1Sweep 2Sweep 3Sweep 4Sweep 5 7.70E-115.929E-217.20E-115.184E-216.90E-114.761E-215.80E-113.364E-216.50E-114E-21 6.20E-113.844E-216.20E-113.844E-216.70E-114.489E-215.80E-113.364E-215.20E-113E-21 6.10E-113.721E-216.10E-113.721E-215.90E-113.481E-215.70E-113.249E-214.40E-112E-21 4.80E-112.304E-215.70E-113.249E-215.30E-112.809E-215.60E-113.136E-214.40E-112E-215.13743E-11 W RMS Avg 4.70E-112.209E-215.60E-113.136E-215.30E-112.809E-215.00E-112.5E-214.30E-112E-21 At the Antenna 4.60E-112.116E-215.30E-112.809E-214.80E-112.304E-214.30E-111.849E-214.30E-112E-21 4.50E-112.025E-215.10E-112.601E-214.60E-112.116E-214.20E-111.764E-214.30E-112E-21-102.89 dBm RMS Avg 4.20E-111.764E-214.90E-112.401E-214.50E-112.025E-214.20E-111.764E-214.20E-112E-21 At the Antenna 4.20E-111.764E-214.60E-112.116E-214.20E-111.764E-214.10E-111.681E-214.20E-112E-21 4.10E-111.681E-214.40E-111.936E-214.20E-111.764E-214.00E-111.6E-214.20E-112E-21 -60.07 dBm RMS Avg EIRP 5.23E-11 watts RMS5.567E-11 watts RMS5.322E-11 watts RMS4.927E-11 watts RMS4.65E-11 watts RMS -72.81 dBm RMS -72.54 dBm RMS -72.74 dBm RMS -73.07 dBm RMS -73.32 dBm RMS Sweep 6Sweep 7Sweep 8Sweep 9Sweep 10 6.30E-113.969E-218.70E-117.569E-216.60E-114.356E-217.50E-115.625E-217.10E-115E-21 6.00E-113.6E-217.80E-116.084E-216.30E-113.969E-216.70E-114.489E-215.60E-113E-21 5.30E-112.809E-215.80E-113.364E-215.30E-112.809E-215.70E-113.249E-215.10E-113E-21 5.20E-112.704E-214.90E-112.401E-214.70E-112.209E-215.60E-113.136E-215.00E-113E-21 5.20E-112.704E-214.80E-112.304E-214.20E-111.764E-215.50E-113.025E-214.60E-112E-21 4.70E-112.209E-214.20E-111.764E-214.10E-111.681E-214.90E-112.401E-214.60E-112E-21 4.50E-112.025E-214.10E-111.681E-213.90E-111.521E-214.90E-112.401E-214.50E-112E-21 4.40E-111.936E-214.00E-111.6E-213.90E-111.521E-214.90E-112.401E-214.40E-112E-21 4.20E-111.764E-213.80E-111.444E-213.70E-111.369E-214.80E-112.304E-214.40E-112E-21 4.00E-121.6E-233.70E-111.369E-213.70E-111.369E-214.80E-112.304E-214.20E-112E-21 4.872E-11 watts RMS5.439E-11 watts RMS4.751E-11 watts RMS5.598E-11 watts RMS5.02E-11 watts RMS -73.12 dBm RMS-72.65dBm RMS-73.23dBm RMS-72.52dBm RMS-73.00dBm RMS Excel Spreadsheet of 1000MHz data point Preamplifier – Component Side
Attestation Statements
1 Date: October 14, 2003 Subject: Response to Correspondence # 25822 From: David Masucci To: Joe Dichoso FCC ID: Q5ZQUPID2003 This memorandum is in response to FCC Correspondence Letter, Reference # 25822. We have retaken the RMS average data using a new rented Agilent PSA E4446A. The Serial Number is: US42510271. The unit was calibrated on 7/25/03. This analyzer has the capability to measure directly in RMS AVERAGE mode. The process for setting up the analyzer to measure as per the PART 15 guidelines is as follows: Detector mode = average Avg/VBW Type = Pwr Avg (RMS) According to the documentation that comes with the E446A: “The combination of the average detector and the power method is equivalent to what is sometimes referred to as “RMS detection””. According to section 2.2.5.3 Pwr Avg (RMS), this mode provides RMS averaging because “the resulting voltage is proportional to the square root of the mean of the square of the voltage”. “PAvg appears on the left side of the display.” N = the number of averages. To average the very low PRF of the QUPID transmitter, N was set to equal 1000 for the 1 MHz bandwidth. For the narrowband sweeps (1 KHz), in the two GPS bands, (15.511e) it was found that the sweep time was slow enough that one sweep was sufficient to capture the correct value. All measurements were taken in a semi-anechoic environment (outdoors), at a distance of 3 meters. The measurement antenna is an EMCO 3115 double-ridged waveguide horn with a frequency range from 1 GHz to 18 GHz. The Antenna gain, cable loss, and 3 meter path loss were all entered into a correction field in the E4446A called “external preamp gain”. The correction is for antenna gain, +2.2 dB for cable loss, and +49.2 dB for 3 meter path loss. The total correction entered into the analyzer is - 42.8 dB. Therefore the spectral plots are reading directly in EIRP . Note as shown in Figure 3, the noise floor of the system is -34.3 dBm EIRP. Note that this is above the -41.3 dBm limit as defined in Part 15. Due to the very low PRF and very low duty cycle, it was necessary to have the 10 dB of attenuation in to keep the analyzer out of compression. 2 FIGURE 1. 960 MHz to 1610 MHz – 1 MHz RBW – RMS AVERAGE FCC Limit = -53.3 dBm Actual = -34.7 dBm 3 FIGURE 2. 1610 MHz to 1990 MHz – 1 MHz RBW – RMS AVERAGE FCC Limit = -51.3 dBm Actual = -35 dBm Outdoor Test Range: Cell Phone Signals 4 FIGURE 3. 1990 MHz to 2000 MHz – 1 MHz RBW – RMS AVERAGE FCC Limit = -41.3 dBm Actual = -34.3 dBm Note: Noise floor only. No QUPID signal detected at these levels. 5 FIGURE 4. 1164 MHz to 1240 MHz – 1 KHz RBW – RMS AVERAGE FCC Limit = -63.3 dBm Actual = -66.9 dBm 6 FIGURE 5. 1559 MHz to 1610 MHz – 1 KHz RBW – RMS AVERAGE FCC Limit = -63.3 dBm Actual = -68.7 dBm 7 FIGURE 6. 1500 MHz to 3000 MHz – 1 MHz RBW – RMS AVERAGE FCC Limit = -41.3 dBm Actual = -13.3 dBm Outdoor test range: Cell Phone Signals 8 FIGURE 7. 2000 MHz to 2500 MHz – 1 MHz RBW – RMS AVERAGE FCC Limit = -41.3 dBm Actual = -13.3 dBm 9 FIGURE 8. 2000 MHz to 4000 MHz – 1 MHz RBW – RMS AVERAGE FCC Limit = -41.3 dBm Actual = -12.9 dBm Note: No signals of any kind or level detected beyond 4 GHz.
Attestation Statements
Date: November 4, 2003 Subject: Response to Correspondence # 25914 From: David Masucci To: Joe Dichoso FCC ID: Q5ZQUPID2003 This memorandum is in response to FCC Correspondence Letter, Reference # 25914. We have retaken the 3 meter RMS average data using the rented Agilent PSA E4446A. The Serial Number is: US42510271. The unit was calibrated on 7/25/03. The changes for this test are sweep time and trace averaging. The sweep time was set to 601mS (with 601 points) for all 1 MHz RBW sweeps, and trace averaging was turned off. All previous scans were repeated. Detector mode = average Avg/VBW Type = Pwr Avg (RMS) The correction factors were entered into the analyzer based on the following table. These corrections were turned on for all sweeps. Frequency Antenna Gain Cable Loss 3 Meter Path Loss Correction Value 1000 MHz -5.8 dB 1.5 dB 42.0 dB 37.7 dB 1500 MHz -8.1 dB 1.9 dB 45.5 dB 39.3 dB 2000 MHz -7.9 dB 2.2 dB 48.0 dB 42.3 dB 2500 MHz -8.7 dB 2.5 dB 49.9 dB 43.7 dB 3000 MHz -8.8 dB 2.8 dB 51.5 dB 45.5 dB 3500 MHz -8.9 dB 3.2 dB 52.8 dB 47.1 dB 4000 MHz -8.5 dB 3.4 dB 54.0 dB 48.9 dB 1 FIGURE 1. 960 MHz to 1610 MHz – 1 MHz RBW – RMS AVERAGE FCC Limit = -53.3 dBm Actual = -38.51 dBm 2 Outdoor Test Range: Cell Phone Signals FIGURE 2. 1610 MHz to 1990 MHz – 1 MHz RBW – RMS AVERAGE FCC Limit = -51.3 dBm Actual = -37.5 dBm 3 FIGURE 3. 1990 MHz to 2000 MHz – 1 MHz RBW – RMS AVERAGE FCC Limit = -41.3 dBm Actual = -35.36 dBm Note: Noise floor only. No QUPID signal detected at these levels. 4 FIGURE 4. 1164 MHz to 1240 MHz – 1 KHz RBW – RMS AVERAGE FCC Limit = -63.3 dBm Actual = -72.1 dBm 5 FIGURE 5. 1559 MHz to 1610 MHz – 1 KHz RBW – RMS AVERAGE FCC Limit = -63.3 dBm Actual = -71.8 dBm 6 Outdoor test range: Cell Phone Signals FIGURE 6. 1500 MHz to 3000 MHz – 1 MHz RBW – RMS AVERAGE FCC Limit = -41.3 dBm Actual = -14.1 dBm 7 FIGURE 7. 2000 MHz to 2500 MHz – 1 MHz RBW – RMS AVERAGE FCC Limit = -41.3 dBm Actual = -13.85 dBm 8 FIGURE 8. 2000 MHz to 4000 MHz – 1 MHz RBW – RMS AVERAGE FCC Limit = -41.3 dBm Actual = -13.8 dBm Note: No signals of any kind or level detected beyond 4 GHz. 9 In response to question number 2. The QUPID transmitter waveform is generated by an impulse excitation of a (tuned) passive linear network. The network is tuned to a nominal frequency of 2.35 GHz and is part of the antenna structure of the transmitter. The excitation is a continuous series of impulses that have a nominal period of 409.6 μs (Pulse Repetition Rate [PRF] of 2.441 KHz), with approximately a 6% time dithering by a PN sequence. At each impulse, the linear network rings at a center frequency of 2.35 GHz for a period of approximately 3 ns, giving the appearance of a 2.35 GHz carrier modulated by a 3 ns pulse. There is no carrier oscillator, no gating or bursting of the transmitter PRF, no hopping, and no sweeping. The modulation is defined as P0 (P zero) indicating that it is a pulsed carrier without any modulation intended to carry information (e.g. radar). The transmitter cannot be modified for a continuous wave operation as there is no oscillator or transmitter amplifiers. 10 In-Band PEAK sweep 11
Attestation Statements
1 Date: January 12, 2004 Subject: Response to Correspondence # 25979 From: David Masucci To: Joe Dichoso FCC ID: Q5ZQUPID2003 Dear Joe, Julius Knapp has advised us to stop further testing activities while the waiver was pending, and until a sample could be tested by your lab. We would like to formally request a 6 month extension to be granted in responding to your questions in correspondence #25979 Best Regards, David Masucci RF/Microwave Engineer Vista Controls 30 Porter Rd. Littleton, Ma. 01460 978-952-2058
Cover Letter(s)
17 July, 2003 Federal Communications Commission EQUIPMENT APPROVAL SERVICES P.O. Box 358315 Pittsburgh, PA 15251-5315 Attention: Subject: Submittal of FCC FORM 731, APPLICATION FOR QUPID EQUIPMENT AUTHORIZATION Dear Sirs, Curtiss-Wright /Vista Controls [CW/VC] is pleased to submit the enclosed FCC Form 731 in application for QUPID equipment authorization. CWFS/VC has prepared the subject application, which describes our comprehensive approach to the development of the QUPID sensor. This submittal includes Exhibits A through G which provides a detailed description of the equipment, its theory of operation, performance analysis and test results necessary to complete the requirements listed in the FCC First Report and Order, released February 14, 2002. CWFS/VC is confident that we have developed equipment that has low technical, schedule and cost risk, and looks forward to initiating this effort as soon as possible. Thank you for the opportunity to submit an application for authorization of this equipment. If any further information is needed, please call me at (978) 952-2058. Very truly yours, David Masucci Fax: (978) 952-2002 RF/Microwave Engineer E-Mail: mailto:[email protected]
Cover Letter(s)
July 17, 2003 Federal Communications Commission 7435 Oakland Mills Road Columbia, MD. 21046 Attention: Reviewing Engineer Subject: CONFIDENTIALITY REQUEST for QUPID [FCC ID: Q5ZQUPID2003] To Whom It May Concern: This letter serves as an official request for confidentiality under FCC Rule Section 0.459. Our statement of reasons is as follows: 1) We request that all schematics, and block diagrams which have been marked “PROPRIETARY DATA” be withheld from public review. These documents contain critical design information that is a Vista Controls trade secret. 2) The information contained in the schematics and diagrams in not provided to any third parties unless non-disclosure agreements have been established with said parties and Vista Controls. 3) Ultra Wideband (UWB) technology is highly sought after by domestic and foreign competition. 4) The QUPID sensor was originally developed by Anro Engineering, Inc., pursuant to patents of Dr. Gerald F. Ross. [Pat. 6,208,248 B1] Dr. Ross is recognized as a pioneer in the field of Ultra Wideband technology. This development effort has been on-going since the early 1970’s. Public disclosure of our detailed design information would greatly assist competition. 5) Vista Controls must protect its intellectual property in order to continue to be a viable source of UWB and other new technology. Disclosure would financially impact Vista controls, and would cause irreversible damage to our company, and its workforce. 6) Vista Controls requests that all information marked “PROPRIETARY DATA” not be disclosed for a period of 5 years. This is adequate to protect Vista Controls market lead in the burgeoning UWB market place. Sincerely, David Masucci RF/Microwave Engineer Curtiss Wright/Vista Controls 30 Porter Rd. Littleton, Ma. 01460
Cover Letter(s)
Federal Communications CommissionDA 07-198 Before the Federal Communications Commission Washington, D.C. 20554 In the matter of Curtis-Wright Controls Inc. Embedded Computing Petition for Waiver of the Part 15 Ultra-Wideband (UWB) Regulations ) ) ) ) ) ORDER Adopted: January 25, 2007Released: January 26, 2007 By the Chief, Office of Engineering and Technology: I.INTRODUCTION 1.By this action, we are granting the Petition for Waiverfiledby Curtiss-Wright Controls Inc. Embedded Computing(“CWCEC”) to permit the certification and subsequent marketing and operation of a limited number of units of its Quick Reaction Perimeter Intrusion Detection (“QUPID”) fixed surveillance ultra-wideband (“UWB”)imaging system. 1 CWCEC requests a waiver of the average and peak emission limits in rule Sections 15.511(c) and (e)for its QUPID transmitter. 2 We find that a grant of this waiver would allow for the operation of devices that support homeland security byproviding protection from terrorist acts and other undesired intrusions tohigh risk, secured facilities. While we are permitting CWCEC’s QUPID transmitter to operate a…
Text truncated - open the document above for the full version.
Contact Information
Applicant
David R Masucci(Sr. RF Engineer)
Technical Contact
Curtiss Wright /Vista ControlsDavid R Masucci
[email protected]978-952-2058
30 Porter Rd. · Littleton, Massachusetts · United States
Non-Technical Contact
Curtiss Wright / Vista ControlsDenis G Lussier
[email protected]978-952-2033
Test Firm
National Technical Systems (NTS)Jeff Viel
Technical Specifications
| # | Rule Parts | Frequency Range | Power Output |
|---|---|---|---|
| 1 | 15F | 2.09 GHz - 3.12 GHz | - |