2AARD0001LNL-1A
FUJI TECOM INC.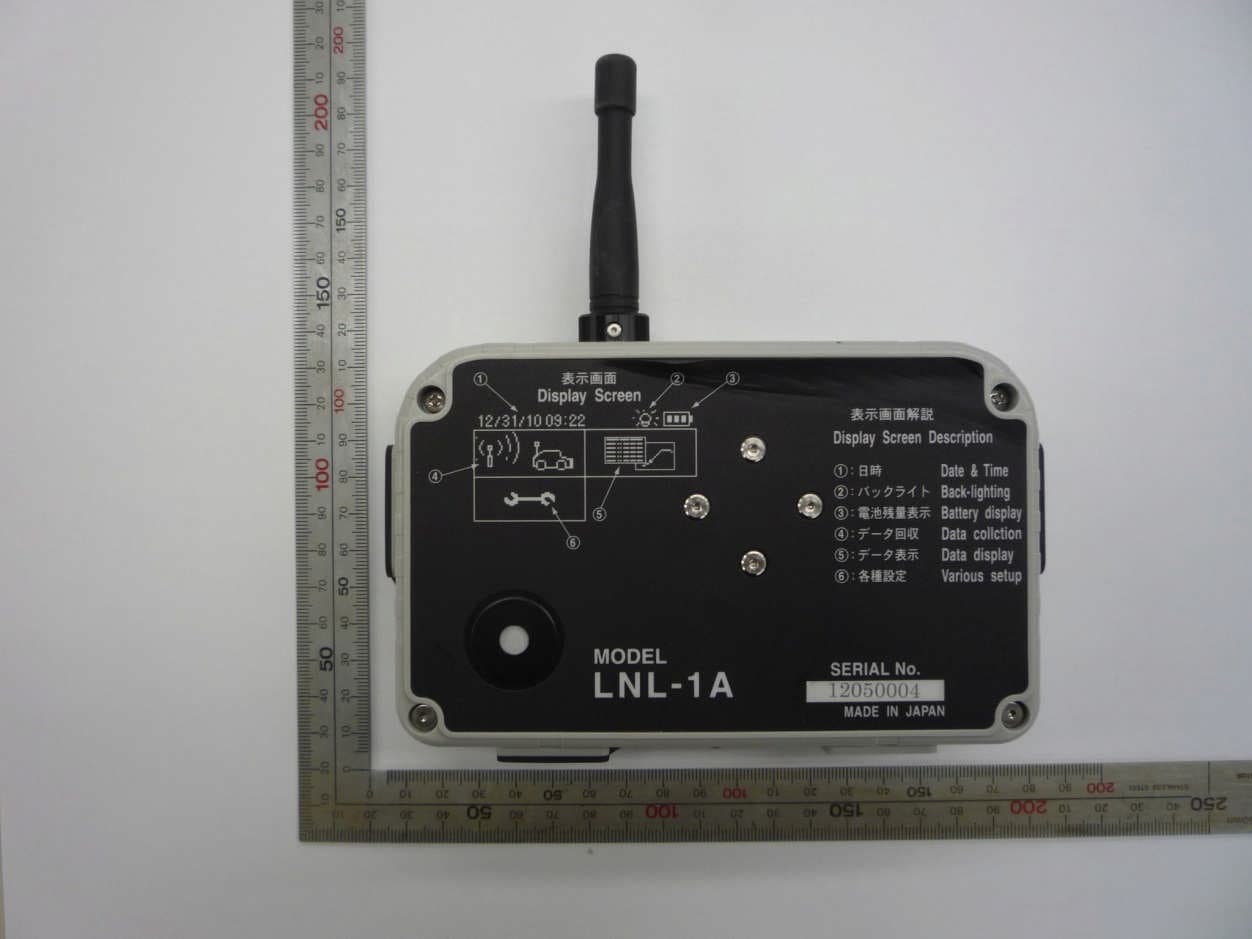
Click to zoom
Application Details
- Equipment Class
- DSR - Part 15 Remote Control/Security Device Transceiver
- Date of Grant
- Mar 25, 2014
- Application Purpose
- Original Equipment
- Date of Application
- Mar 17, 2014
- Equipment Note
- LNL-1A
- Frequency Range
- 429.25000000 - 429.47500000
- Company
- FUJI TECOM INC.
- Country
- Japan
Documents & Files
Document Text
Text extracted from the exhibit documents filed with the FCC. Open a document above to read the original.
Users Manual
LNL-1 manual Fujitecom., Inc. 2013 Pipeline Leak Noise Monitoring System LNL-1 Fuji Leak Nets Operation Manual Fuji Tecom Inc. February 20, 2014 LNL-1 manual Fujtecom., Inc. 2014 2 Table of contents What is Fuji Leak Nets? .......................................................................................................................................... 4 Application.............................................................................................................................................................. 4 System configuration .............................................................................................................................................. 5 Safety precautions ................................................................................................................................................... 6 [Hardware] 1.Product configuration.....................................................................................................................................11 1-1Standard products ..................................................................................................................................11 1-2Optional accessories ..............................................................................................................................11 2.Name of each part and explanation of switches ............................................................................................ 12 2-1Analyzer ............................................................................................................................................... 12 2-2Logger .................................................................................................................................................. 13 3.Before use of the product .............................................................................................................................. 14 4.Work flow ..................................................................................................................................................... 15 4-1Monitoring of pipeline.......................................................................................................................... 15 4-2Selection of pipeline ............................................................................................................................. 16 5.Setting of device and operating procedure .................................................................................................... 17 6.Display and function of logger...................................................................................................................... 18 6-1Turning on the power supply................................................................................................................ 18 6-2Turning off the power supply ............................................................................................................... 18 7.Analyzer display screen and function ........................................................................................................... 19 7-1“Start screen”........................................................................................................................................ 19 7-2“Main menu” ........................................................................................................................................ 19 7-3“Logger Data Collection Menu” .......................................................................................................... 20 7-4“Data Display Menu” ........................................................................................................................... 21 7-4-1“Logger List Display Screen” ........................................................................................................ 21 7-4-2“Min. sound level list display screen” ........................................................................................... 21 7-4-3“Trend Graph Display” .................................................................................................................. 22 7-4-4“Distribution Display Screen” ....................................................................................................... 22 7-5“Setting Menu”..................................................................................................................................... 23 7-5-1“Logger ID Editing Screen (Logger Selection)”............................................................................ 24 7-5-2“Logger ID Editing Screen (ID Edit)” ........................................................................................... 24 7-5-3“Date/time Setting Screen” ............................................................................................................ 25 7-5-4“Measurement Time Setting Screen” ............................................................................................. 25 7-5-5“Threshold Value Setting Screen”.................................................................................................. 26 7-5-6“Data Collection Time Setting Screen” ......................................................................................... 26 7-5-7“Data Collection Day-of-week Setting Screen”............................................................................. 27 7-5-8“Logger Setting Screen” ................................................................................................................ 28 7-5-9AnalyzerMemory Capacity Check Screen” ............................................................................... 29 7-5-10“Data Delete Selection Screen” ..................................................................................................... 30 7-5-11Logger Test Mode Screen” .............................................................................................…
Text truncated - open the document above for the full version.
External Photos
- 1 - Appearance photo of Analyzer Front view Rear view - 2 - Top view Bottom view - 3 - Side view (Right) Side view (Left)
Internal Photos
- 1 - Disassembly photo of Analyzer Remove at rear case and 6 screw Remove at main PCB and 6 screw - 2 - Structure of main PCB Remove at RF module and SD card module RF module unit SD card module - 3 - View of main PCB without RF module and SD card module Bottom of main PCB - 4 - Top of RF module Bottom of RF module - 5 - Top of SD card module Bottom of SD card module - 6 - LCD PCB with front case Front case without LCD PCB,USB PCB,Battery and harness of power SW LCD USB PCB Harness of power SW Battery - 7 - Battery position LCD module Battery - 8 - USB assembly Bottom of USB PCB
Test Report
e-OHTAMA, LTD., Tokyo LaboratoryTest Report Number EOTEL001 2-8-20 Kurigi, Asao-ku Kawasaki-shi, Kanagawa, JapanForm Rev. 1.00 TEL: +81-44-980-2052 Page 2 of 18 Page Cover Page.......................................................................................................................................................1 Table of Contents..............................................................................................................................................2 1.Summary ................................................................................................................................................ 3 1.1Terms and definitions .................................................................................................................... 3 1.2Standard(s) and Result.................................................................................................................. 3 1.3Deviations from Standard(s) .......................................................................................................... 3 1.4Antenna Requirements .................................................................................................................. 3 2.Equipment Under Test (EUT) ................................................................................................................. 4 2.1General Descriptions ..................................................................................................................... 4 2.2Detailed Descriptions..................................................................................................................... 4 2.3Labeling Requirements.................................................................................................................. 4 2.4Measurement Condition ................................................................................................................ 5 3.Test Data................................................................................................................................................ 6 3.1Test specification........................................................................................................................... 6 3.220dB Bandwidth / 99% Bandwidth................................................................................................. 7 3.3Conditions for intentional radiators to comply with periodic operation ........................................... 8 3.4Field strength of Emissions.......................................................................................................... 10 3.5Line Conducted Mesurement Data .............................................................................................. 14 4.Photographs of Test setup.................................................................................................................... 16 5.Test facility ......................................................................................................................................... 188 5.1Test Instruments........................................................................................................................ 188 5.2Interconnecting Cables .............................................................................................................. 188 e-OHTAMA, LTD., Tokyo LaboratoryTest Report Number EOTEL001 2-8-20 Kurigi, Asao-ku Kawasaki-shi, Kanagawa, JapanForm Rev. 1.00 TEL: +81-44-980-2052 Page 3 of 18 1. Summary 1.1Terms and definitions AV Average DoC Declaration of Conformity EUT Equipment Under Test QP Quasi-peak 1.2Standard(s) and Result Applied Standard(s) Normative Reference(s)Test LimitFCC Part and RSS Section(s) ResultReference Clause No. FCC Part15 Subpart C IC 20dB Bandwidth 99%Bandwidth FCC 15.231 (c)L imits15.215(c) N/A Pass3.2 Conditions for intentional radiators to comply with periodic operation FCC 15.231 (e)L imits15.231(e)Pass3.3 Field StrengthFCC 15.31(e) limits FCC 15.209 limits FCC 15.231 limits RSS-210 table A or B limits 15.31(e) 15.231 (b)(e) RSS-210 A1.1 Pass3.4 AC Conducted Emission 150 kHz - 30 MHz FCC 15.207 limits RSS-Gen table 2 limits 15.207 RSS-Gen 7.2.2 Pass3.5 Table 1Standard and result 1.3Deviations from Standard(s) There was no deviation from the standard. 1.4Antenna Requirements Excerpt from §15.203 of the FCC Rules/Regulations: “An intentional radiator antenna shall be designed to ensure that no antenna other than that furnished by the responsible party can be used with the device. The use of a permanently attached antenna or of an antenna that uses a unique coupling to the intentional radiator shall be considered sufficient to comply with the provisions of this section.” The antennas of the FUJI TECOM.INC’s Leak noise logger are permanently attached. The connection to an outside antenna becomes the structure not to come off easily to fix it by a special screw. Conclusion: The FUJI TECOM INC. FCC ID: 2AARD0001 equipment complies with the requirement of §15.203. e-OHTAMA, LTD., Tokyo LaboratoryTest Report Number EOTEL001 2-8-20 Kurigi, Asao-ku Kawasaki-shi, Kanagawa, JapanForm Rev. 1.00 TEL: +81-44-980-2052 Page 4 of 18 2. Equipment Under Test (EUT) 2.1General Descriptions The loggers mounted with sensors are installed on the ancillary equipment of water pipeline such as valves, fire hydrants and air valves, and “minimum sound levels of water leak noise” are collected at a certain interval. The minimum sound levels recorded on the loggers are transmitted to the data collector via radio communication. The collected minimum sound levels are judged normal or abnormal based on the threshold in the management software and the results are displayed on the map. In addition, the respective logger data displayed in the graph can be compared, and ageing variation can be found. Therefore, faulty pipelines can be detected very effectively. 2.2Detailed Descriptions Product NameAnalyzer Model NumberLNL-1A Serial Number130…
Text truncated - open the document above for the full version.
Test Setup Photos
e-OHTAMA, LTD., Tokyo Laboratory 2-8-20 Kurigi, Asao-ku Kawasaki-shi, Kanagawa, Japan TEL: +81-44-980-2052 Page 1 of 2 Test Setup Photos (Analyzer) Photo1 Field strength emissions & Bandwidth (Antenna side) Photo2 Field strength emissions & Bandwidth (EUT side) e-OHTAMA, LTD., Tokyo Laboratory 2-8-20 Kurigi, Asao-ku Kawasaki-shi, Kanagawa, Japan TEL: +81-44-980-2052 Page 2 of 2 Photo3 Conducted Test 1 Photo4 Conducted Test_2
Contact Information
Applicant
Hiroshi Takemura(Deputy Group Leader Technical Development Group)
Technical Contact
FUJI TECOM INC.Katsuhiro Kaji
[email protected]01181484790585
8-6-16 Nobidome · Niiza City, Saitama · Japan
Non-Technical Contact
e-OHTAMA, LTD.Katsutoshi Hatanaka
[email protected]01181448198601
Test Firm
e-OHTAMA LTD., Tokyo EMC CenterHidekazu Taguchi
Technical Specifications
| # | Rule Parts | Frequency Range | Power Output |
|---|---|---|---|
| 1 | 15.231(e) | 429.25 MHz - 429.475 MHz | - |
Other Applications from FUJI TECOM INC.
2AARD0002
Mar 25, 2014LNL-1L
Equipment Class
DSR - Part 15 Remote Control/Security Device Transceiver