Text extracted from the exhibit documents filed with the FCC. Open a document above to read the original.
NOTE: This equipment has been tested and found to comply with the limits for a Class B digital device, pursuant to part 15 of the FCC Rules. These limits are designed to provide reasonable protection against harmful interference in a residential installation. This equipment generates uses and can radiate radio frequency energy and, if not installed and used in accordance with the instructions, may cause harmful interference to radio communications. However, there is no guarantee that interference will not occur in a particular installation. If this equipment does cause harmful interference to radio or television reception, which can be determined by turning the equipment off and on, the user is encouraged to try to correct the interference by one or more of the following measures: - Reorient or relocate the receiving antenna. - Increase the separation between the equipment and receiver. -Connect the equipment into an outlet on a circuit different from that to which the receiver is connected. -Consult the dealer or an experienced radio/TV technician for help Changes or modifications not expressly approved by the party responsible for compliance could void the user's authority to operate the equipment. This device complies with Part 15 of the FCC Rules. Operation is subject to the following two conditions: (1) this device may not cause harmful interference, and (2) this device must accept any interference received, including interference that may cause undesired operation.
Star Technology Industrial Co., Limited Mar. 19, 2020 Federal Communication Commission Authorization and Evaluation Division FCC ID: 2AVTOTWS06S Re: Confidentiality Request Pursuant to Sections 0.457 and 0.459 of the Commission’s Rules, the applicant hereby requests confidential treatment of information applied this application as outlined below: 1: Block Diagram 2: Schematics 3: Operational Description The above materials contain trade secrets and proprietary information not customarily released to the public. The public disclosure of these matters might be harmful to the applicant and provide unjustified benefits to its competitors. The Applicant understands that pursuant to Rules 0.457, disclosure of this Application and all accompanying documentation will not be made before the date of the Grant for this application. Sincerely, Star Technology Industrial Co., Limited Contact person: Lily Huang
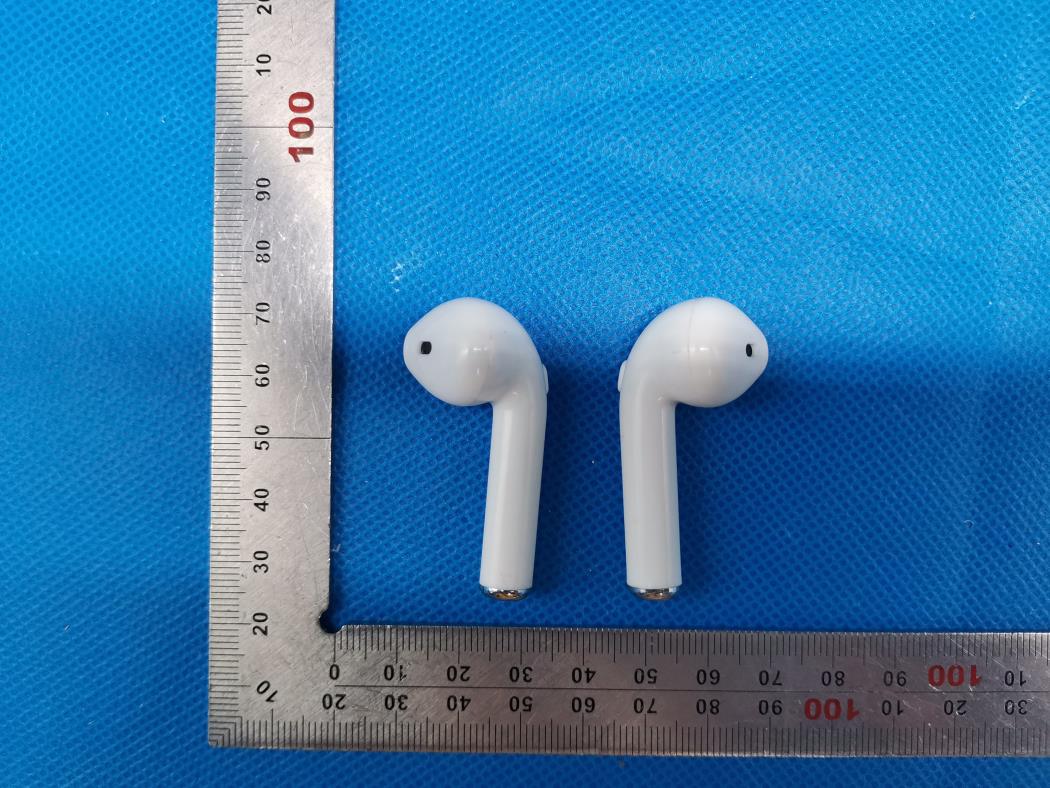
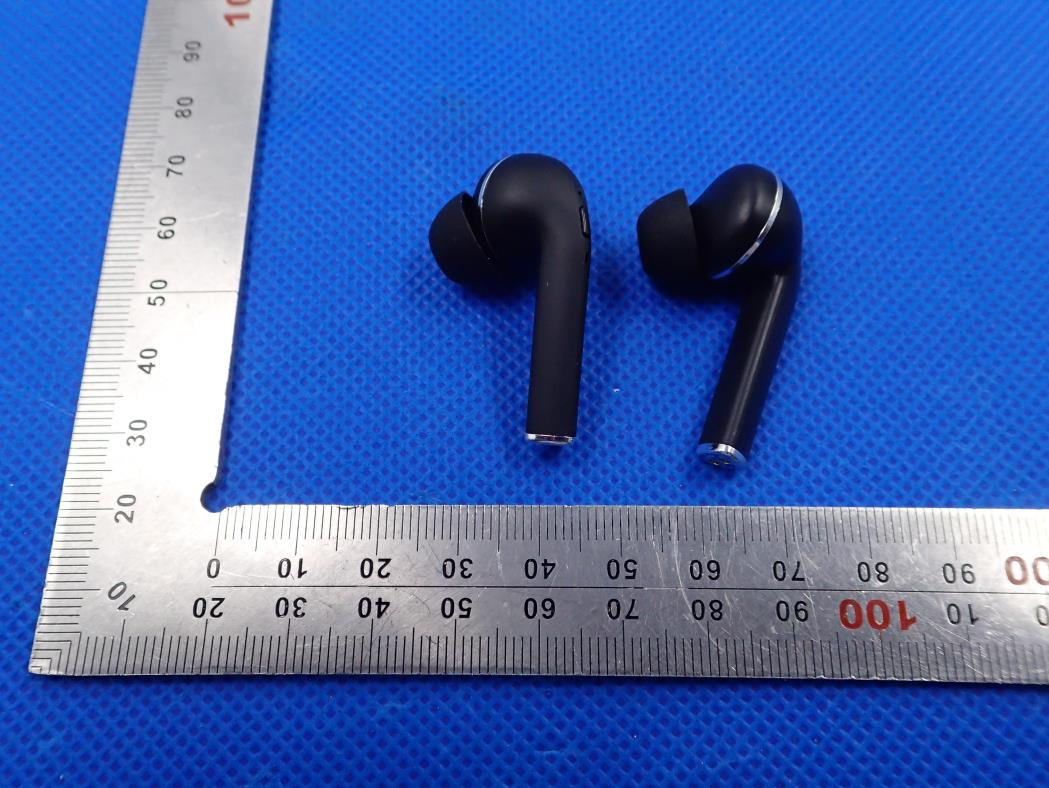
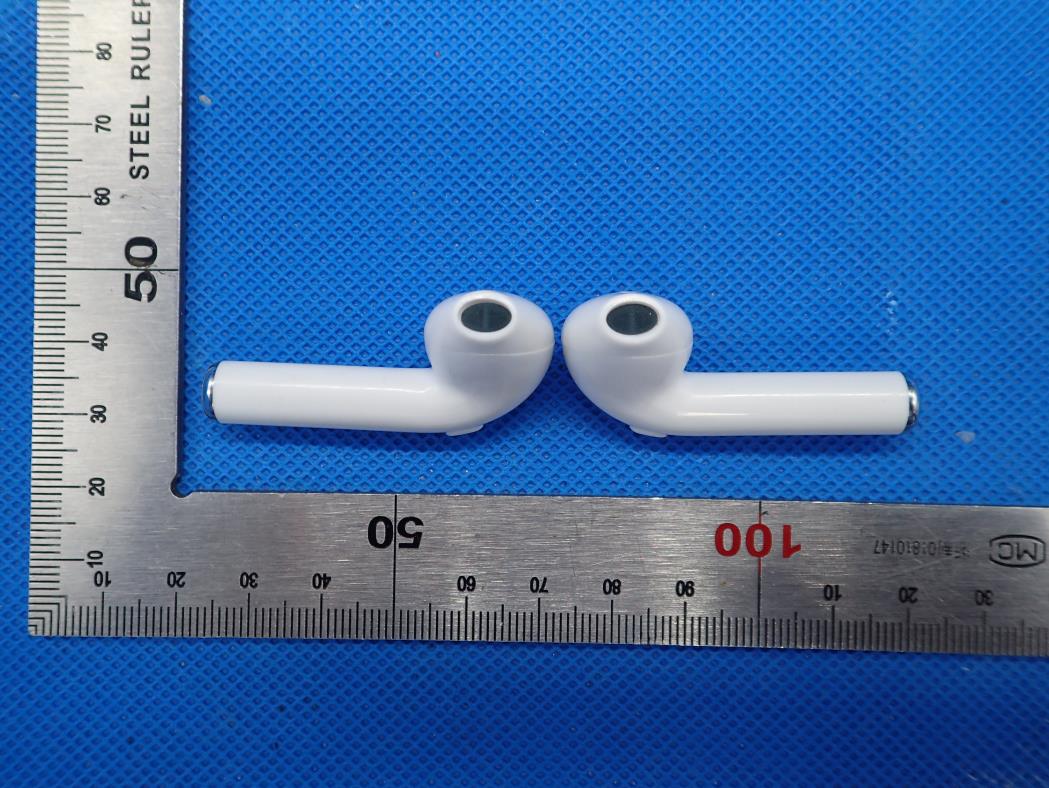
External Photos TOP VIEW OF EUT BOTTOM VIEW OF EUT FRONT VIEW OF EUT BACK VIEW OF EUT LEFT VIEW OF EUT RIGHT VIEW OF EUT Charging Dock TOP VIEW OF EUT BOTTOM VIEW OF EUT FRONT VIEW OF EUT BACK VIEW OF EUT LEFT VIEW OF EUT RIGHT VIEW OF EUT
FCC ID Label Location FCC ID:2AVTOTWS06S
Internal Photos OPEN VIEW OF EUT-1 OPEN VIEW OF EUT-2 VIEW OF BATTERY INTERNAL VIEW OF EUT-1 Antenna Antenna INTERNAL VIEW OF EUT-2 INTERNAL VIEW OF EUT-3
Page 1 of 68 FCC Test Report Report No.: AGC00806200104FE03 FCC ID : 2AVTOTWS06S APPLICATION PURPOSE : Original Equipment PRODUCT DESIGNATION : TWS Earbud BRAND NAME : N/A MODEL NAME : TWS06S, TWS06, EB5528, EB5469 CLIENT : Star Technology Industrial CO.,Limited DATE OF ISSUE : Mar. 18, 2020 STANDARD(S) : FCC Part 15.247 REPORT VERSION : V1.0 Attestation of Global Compliance (Shenzhen) Co., Ltd CAUTION: This report shall not be reproduced except in full without the written permission of the test laboratory and shall not be quoted out of context. Report No.: AGC00806200104FE03 Page 2 of 68 REPORT REVISE RECORD Report Version Revise Time Issued Date Valid Version Notes V1.0 / Mar. 18, 2020 Valid Initial Release Report No.: AGC00806200104FE03 Page 3 of 68 TABLE OF CONTENTS 1. VERIFICATION OF CONFORMITY ............................................................................................................... 5 2. GENERAL INFORMATION ............................................................................................................................ 6 2.1. PRODUCT DESCRIPTION ..................................................................................................................... 6 2.2. TABLE OF CARRIER FREQUENCYS .................................................................................................... 6 2.3. RECEIVER INPUT BANDWIDTH ............................................................................................................ 7 2.4. EXAMPLE OF A HOPPING SEQUENCY IN DATA MODE ...................................................................... 7 2.5. EQUALLY AVERAGE USE OF FREQUENCIES AND BEHAVIOUR ....................................................... 7 2.6. RELATED SUBMITTAL(S) / GRANT (S) ................................................................................................. 8 2.7. TEST METHODOLOGY .......................................................................................................................... 8 2.8. SPECIAL ACCESSORIES ....................................................................................................................... 8 2.9. EQUIPMENT MODIFICATIONS .............................................................................................................. 8 3. MEASUREMENT UNCERTAINTY ................................................................................................................. 9 4. DESCRIPTION OF TEST MODES ............................................................................................................... 10 5. SYSTEM TEST CONFIGURATION ............................................................................................................. 11 5.1. CONFIGURATION OF EUT SYSTEM .................................................................................................... 11 5.2 EQUIPMENT USED IN TESTED SYSTEM ............................................................................................. 11 5.3. SUMMARY OF TEST RESULTS ............................................................................................................ 11 6. TEST FACILITY ........................................................................................................................................... 12 7. PEAK OUTPUT POWER ............................................................................................................................. 13 7.1. MEASUREMENT PROCEDURE ........................................................................................................... 13 7.2. TEST SET-UP (BLOCK DIAGRAM OF CONFIGURATION).................................................................. 13 7.3. LIMITS AND MEASUREMENT RESULT ............................................................................................... 14 8. 20DB BANDWIDTH ..................................................................................................................................... 20 8.1. MEASUREMENT PROCEDURE ........................................................................................................... 20 8.2. TEST SET-UP (BLOCK DIAGRAM OF CONFIGURATION).................................................................. 20 8.3. LIMITS AND MEASUREMENT RESULTS ............................................................................................ 20 9. CONDUCTED SPURIOUS EMISSION ........................................................................................................ 27 9.1. MEASUREMENT PROCEDURE ........................................................................................................... 27 9.2. TEST SET-UP (BLOCK DIAGRAM OF CONFIGURATION).................................................................. 27 9.3. MEASUREMENT EQUIPMENT USED ................................................................................................. 27 9.4. LIMITS AND MEASUREMENT RESULT ............................................................................................... 27 10. RADIATED EMISSION ............................................................................................................................... 37 Report No.: AGC00806200104FE03 Page 4 of 68 10.1. MEASUREMENT PROCEDURE ......................................................................................................... 37 10.2. TEST SETUP ...................................................................................................................................... 39 10.3. LIMITS AND MEASUREMENT RESULT ............................................................................................. 40 10.4. TEST RESULT .................................................................................................................................... 40 11. NUMBER OF HOPPING FREQUENCY ..................................................................................................... 50 11.1. MEASUREMENT PROCEDURE .......…
Text truncated - open the document above for the full version.
Report No.: AGC00806200104FE03 Page 50 of 68 11. NUMBER OF HOPPING FREQUENCY 11.1. MEASUREMENT PROCEDURE The EUT shall have its hopping function enabled. Use the following spectrum analyzer settings: 1. Span: The frequency band of operation. Depending on the number of channels the device supports, it may be necessary to divide the frequency range of operation across multiple spans, to allow the individual channels to be clearly seen. 2. RBW: To identify clearly the individual channels, set the RBW to less than 30% of the channel spacing or the 20 dB bandwidth, whichever is smaller. 3. VBW ≥ RBW. Sweep: Auto. Detector function: Peak. Trace: Max hold. 4. Allow the trace to stabilize. 11.2. TEST SETUP (BLOCK DIAGRAM OF CONFIGURATION) Same as described in section 8.2 11.3. MEASUREMENT EQUIPMENT USED The same as described in section 6 11.4. LIMITS AND MEASUREMENT RESULT TOTAL NO. OF HOPPING CHANNEL LIMIT (NO. OF CH) MEASUREMENT (NO. OF CH) RESULT >=15 79 PASS TEST PLOT FOR NO. OF TOTAL CHANNELS Note: The GFSK modulation is the worst case and recorded in the report. Report No.: AGC00806200104FE03 Page 51 of 68 12. TIME OF OCCUPANCY (DWELL TIME) 12.1. MEASUREMENT PROCEDURE The EUT shall have its hopping function enabled. Use the following spectrum analyzer settings: 1. Span: Zero span, centered on a hopping channel. 2. RBW shall be≤channel spacing and where possible RBW should be set >> 1 / T, where T is the expected dwell time per channel. 3. Sweep: As necessary to capture the entire dwell time per hopping channel; where possible use a video trigger and trigger delay so that the transmitted signal starts a little to the right of the start of the plot. The trigger level might need slight adjustment to prevent triggering when the system hops on an adjacent channel; a second plot might be needed with a longer sweep time to show two successive hops on a channel. 4. Detector function: Peak. Trace: Max hold. 5. Use the marker-delta function to determine the transmit time per hop. 6. Repeat the measurement using a longer sweep time to determine the number of hops over the period specified in the requirements. The sweep time shall be equal to, or less than, the period specified in the requirements. Determine the number of hops over the sweep time and calculate the total number of hops in the period specified in the requirements, using the following equation: (Number of hops in the period specified in the requirements) = (number of hops on spectrum analyzer) × (period specified in the requirements / analyzer sweep time) 7. The average time of occupancy is calculated from the transmit time per hop multiplied by the number of hops in the period specified in the requirements. 12.2. TEST SETUP (BLOCK DIAGRAM OF CONFIGURATION) Same as described in section 8.2 12.3. MEASUREMENT EQUIPMENT USED The same as described in section 6 12.4. LIMITS AND MEASUREMENT RESULT Channel Time of Pulse for DH5 (ms) Number of hops in the period specified in the requirements Sweep Time (ms) Limit (ms) Low 2.861 23*4 263.212 400 Middle 2.871 25*4 287.100 400 High 2.861 23*4 263.212 400 Note: The 8-DPSK modulation is the worst case and recorded in the report. Report No.: AGC00806200104FE03 Page 52 of 68 TEST PLOT OF LOW CHANNEL Report No.: AGC00806200104FE03 Page 53 of 68 TEST PLOT OF MIDDLE CHANNEL Report No.: AGC00806200104FE03 Page 54 of 68 TEST PLOT OF HIGH CHANNEL Report No.: AGC00806200104FE03 Page 55 of 68 13. FREQUENCY SEPARATION 13.1. MEASUREMENT PROCEDURE The EUT shall have its hopping function enabled. Use the following spectrum analyzer settings: 1. Span: Wide enough to capture the peaks of two adjacent channels. 2. RBW: Start with the RBW set to approximately 30% of the channel spacing; adjust as necessary to best identify the center of each individual channel. 3. Video (or average) bandwidth (VBW) ≥ RBW. 4. Sweep: Auto. e) Detector function: Peak. f) Trace: Max hold. g) Allow the trace to stabilize. Use the marker-delta function to determine the separation between the peaks of the adjacent channels. 13.2. TEST SETUP (BLOCK DIAGRAM OF CONFIGURATION) Same as described in section 6.2 13.3. MEASUREMENT EQUIPMENT USED The same as described in section 6.3 13.4. LIMITS AND MEASUREMENT RESULT CHANNEL CHANNEL SEPARATION LIMIT RESULT KHz KHz Pass CH01-CH02 1005 >=25 KHz or 2/3 20 dB BW TEST PLOT FOR FREQUENCY SEPARATION Note: The 8-DPSK modulation is the worst case and recorded in the report. Report No.: AGC00806200104FE03 Page 56 of 68 14. FCC LINE CONDUCTED EMISSION TEST 14.1. LIMITS OF LINE CONDUCTED EMISSION TEST Frequency Maximum RF Line Voltage Q.P.( dBuV) Average( dBuV) 150kHz~500kHz 66-56 56-46 500kHz~5MHz 56 46 5MHz~30MHz 60 50 Note: 1. The lower limit shall apply at the transition frequency. 2. The limit decreases linearly with the logarithm of the frequency in the range 0.15 MHz to 0.50 MHz. 14.2. BLOCK DIAGRAM OF LINE CONDUCTED EMISSION TEST EUT & Support Units Report No.: AGC00806200104FE03 Page 57 of 68 14.3. PRELIMINARY PROCEDURE OF LINE CONDUCTED EMISSION TEST 1. The equipment was set up as per the test configuration to simulate typical actual usage per the user’s manual. When the EUT is a tabletop system, a wooden table with a height of 0.8 meters is used and is placed on the ground plane as per ANSI C63.10 (see Test Facility for the dimensions of the ground plane used). When the EUT is a floor-standing equipment, it is placed on the ground plane which has a 3-12 mm non-conductive covering to insulate the EUT from the ground plane. 2. Support equipment, if needed, was placed as per ANSI C63.10. 3. All I/O cables were positioned to simulate typical actual usage as per ANSI C63.10. 4. All support equipments received AC120V/60Hz power from a LISN, if any. 5. The EUT received DC 3.7V power from battery which received AC120V/60Hz power from a LISN. 6. The test program was started. Emissions were measured on each current carrying line of the EUT using a spectrum Analyzer / Receiver connected to the LISN powering the…
Text truncated - open the document above for the full version.
Test Setup Photos RADIATED EMISSION TEST SETUP BELOW 1GHZ RADIATED EMISSION TEST SETUP ABOVE 1GHZ CONDUCTED TEST SETUP
| # | Rule Parts | Frequency Range | Power Output |
|---|---|---|---|
| 1 | 15C | 2.40 GHz - 2.48 GHz | 800.00 µW |

TWS Earbud with Bluetooth
Equipment Class
DSS - Part 15 Spread Spectrum Transmitter
TWS Earbud
Equipment Class
DSS - Part 15 Spread Spectrum Transmitter