HH4TF5-TXHEART RATE VARIABILITY MONITER
MIE Medical Research Ltd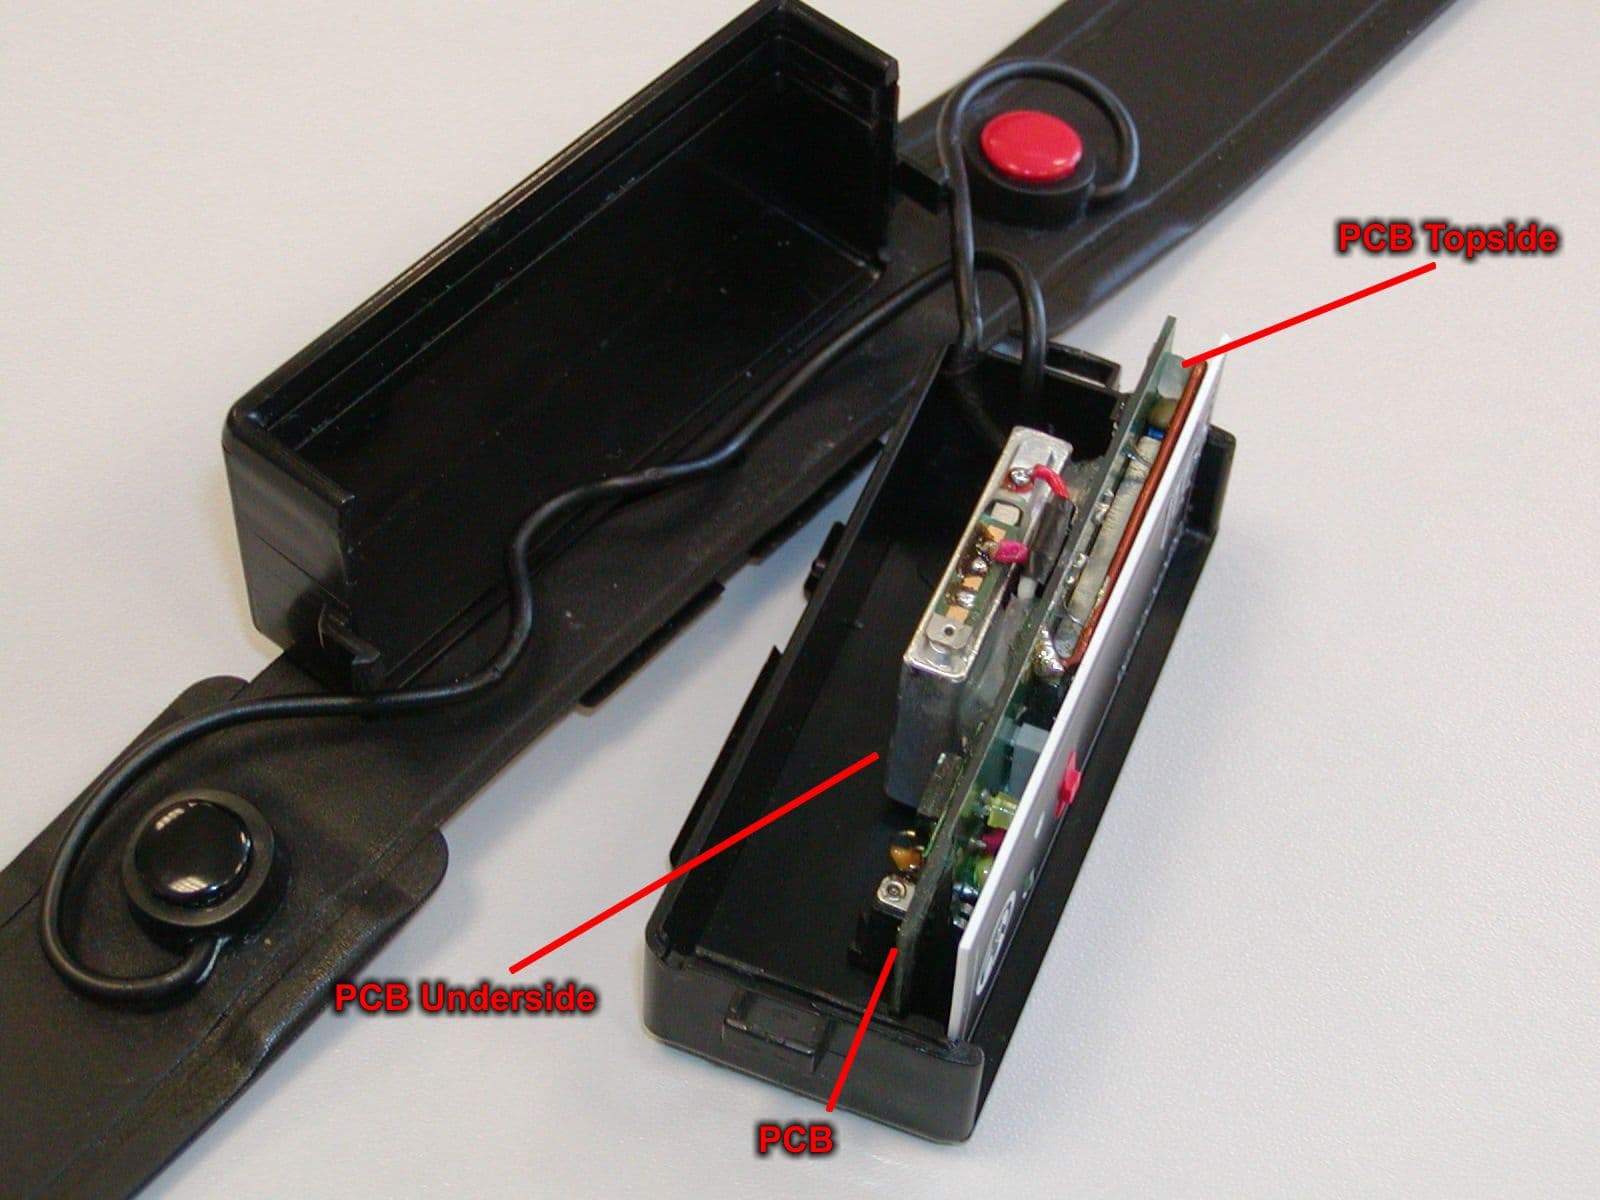
Click to zoom
Application Details
- Equipment Class
- DXX - Part 15 Low Power Communication Device Transmitter
- Date of Grant
- Jul 06, 2003
- Application Purpose
- Original Equipment
- Date of Application
- Jul 06, 2003
- Equipment Note
- HEART RATE VARIABILITY MONITER
- Frequency Range
- 914.50000000 - 914.50000000
- Company
- MIE Medical Research Ltd
- Country
- United Kingdom
Documents & Files
Document Text
Text extracted from the exhibit documents filed with the FCC. Open a document above to read the original.
Users Manual
Doc 125-05 System for Telemetric, Non-invasive, Computer-aided Evaluation of Heart Rate Variability USER MANUAL © 2001-2003, Advanced Medical Diagnostics Group, Ltd. ® (c) 2001-2003 Advanced Medical Diagnostics Group, Ltd Doc 125-05 1 VariaCardio ® TF5 Manual Table of contents: 1.BEFORE YOU BEGIN 3 1.1 WARNINGS 4 DISCLAIMER OF WARRANTY 6 1.2. VARIACARDIO TF5 HELP LINE 6 1.3. CARING FOR THE VARIACARDIO TF5 SYSTEM 6 1.4. TECHNICAL AND SAFETY NOTES 8 2. GENERAL DESCRIPTION 9 2.1. PARTS OF THE VARIACARDIO TF5 9 2.1.1. CHEST BELT WITH UHF-TRANSMITTER 10 2.1.2. UHF-RECEIVER 12 2.2. OTHER COMPONENTS / PRINTER 13 2.3. AC/DC ADAPTER FOR A TRANSMITTER BATTERY AND GUIDELINES FOR ITS CHARGING 14 2.4. PRODUCTION, TESTING, WARRANTY AND TECHNICAL SUPPORT 14 3. VARIACARDIO TF5 PROGRAM PRINCIPLES & CONTROL 16 3.1. WHAT THE SWITCH BUTTONS MEAN 16 3.2. WHAT THE LED DIODES MEAN 16 3.3. WHAT IS THE NORMAL OPERATION SETTING 16 4. OPERATING THE VARIACARDIO TF5 17 4.1. HOW TO INSTALL THE SOFTWARE 17 INSTALLATION WIZARD 18 4.2. HOW TO LAUNCH THE APPLICATION 21 4.3. HOW TO ADJUST THE BELT 22 4.4. HOW TO ADJUST THE COMMUNICATION RECEIVER/COMPUTER: 22 4.5. HOW TO ENTER THE DATA AND/OR TO CONTROL THE SYSTEM 23 5. CLINICAL USE OF THE SYSTEM: DATABASE 24 5.1. BEFORE WE START 24 5.2. HOW TO START THE PROGRAM 24 5.3. THE BASIC OPERATION SCREEN 25 5.4. DATABASE: HOW TO FIND A SUBJECT 27 5.5. DATABASE: HOW TO ADD A NEW SUBJECT RECORD 27 5.6. DATABASE: HOW TO DELETE A RECORD / SUBJECT 29 5.7. DATABASE: HOW TO CHANGE THE DATABASE / CREATE A NEW DATABASE 29 (c) 2001-2003 Advanced Medical Diagnostics Group, Ltd Doc 125-05 2 5.8. DATABASE: HOW TO SET THE DATABASE AS DEFAULT 30 5.9. DATABASE: HOW TO IMPORT DATA OBTAINED BY PREVIOUS MODELS 30 5.10. DATABASE: HOW TO COMPACT THE DATABASE 30 5.11. LICENSE, HARDLOCK, DATA PROTECTION & BUSINESS ISSUES 31 5.12. HOW TO SEND RECORDS AND PROTOCOLS VIA E-MAIL 31 5.13. HOW TO EXPORT AND IMPORT HRV RECORDS 32 6. CLINICAL USE OF THE SYSTEM: MEASUREMENTS 33 6.1. MEASUREMENTS: SPECTRAL TEST MEASURING SCREEN 33 6.2. MEASUREMENTS: HOW TO PERFORM MEASUREMENT 34 6.3. HOW TO BROWSE/EDIT THE DATA 38 6.3.1. ECG BROWSER 41 7. CLINICAL USE OF THE SYSTEM: ANALYSIS 43 7.1. HRV BASICS. HOW TO UNDERSTAND THE PRINCIPLES OF ANALYSIS 43 7.2. HRV BASICS. HOW THE R-R INTERVALS MEASUREMENT WORKS 45 7.3. HRV BASICS. HOW TO UNDERSTAND THE 3D RESULTS 46 7.4. ANALYSIS. HOW TO PERFORM THE ANALYSIS 48 7.4.1. BASIC ANALYSIS SCREEN. 3D RUNNING SPECTRA GRAPH 48 7.4.2. BASIC ANALYSIS SCREEN. STATISTICAL TABLE 50 7.4.3. BASIC ANALYSIS SCREEN. GRAPHICAL TABLE 50 7.4.4. BASIC ANALYSIS SCREEN. RESUME 51 7.4.5. BASIC ANALYSIS SCREEN. EXPORT OF NUMERICAL RESULTS 51 7.5. ANALYSIS. MEDICAL REPORT AND HOW TO OBTAIN IT 52 8. BATTERY OF SHORT CARDIOVASCULAR REFLEX TESTS AS PROPOSED BY EWING (SO-CALLED ‘EWING BATTERY’) 53 8.1. EWING BATTERY: INTRODUCTION 53 8.2. HOW TO PERFORM THE EWING’S TEST BATTERY 53 8.2.1. EWING BATTERY: HOW TO PERFORM THE DEEP BREATHING TEST 55 8.2.2. EWING BATTERY: HOW TO PERFORM THE VALSALVA MANEUVER 57 8.2.2. EWING BATTERY: HOW TO PERFORM THE ORTHOSTATIC TEST 58 9.1. SOME PRACTICAL EXAMPLES 60 9.2. APPLICATION NOTES 61 YOUR NOTES 63 The VariaCardio TF5 system is manufactured and distributed exclusively by Advanced Medical Diagnostics Group, Ltd, UK and its partners. © Copyright 2001-2003, Advanced Medical Diagnostics Group, Ltd. All rights reserved. (c) 2001-2003 Advanced Medical Diagnostics Group, Ltd Doc 125-05 3 1. Before You Begin Thank you for purchasing this VariaCardio TF5 system. The operating instructions that are found in this manual should be followed carefully to ensure many years of reliable service. Please read these instructions thoroughly before using the VariaCardio TF5 system. The operating instructions should allow the average user to become familiar and proficient in the review and editing of patient records generated by the VariaCardio TF5 system. This manual does not teach the operator to recognise or to interpret the records. That information is beyond the scope of this manual. An overview is described later in this document. Manufactured by: MIE Medical Research, Ltd. for Advanced Medical Diagnostics Group, Ltd. 6, Wortley Moor Road, Leeds, LS12 4JF United Kingdom Phone: +44 (0)113 279 1010 Fax: +44 (0)113 2310 820 Website: http://www.amdgmedical.com E-Mail: [email protected] Your VariaCardio TF5 system Serial Number: _____________________ (c) 2001-2003 Advanced Medical Diagnostics Group, Ltd Doc 125-05 4 1.1 Warnings • Do not operate the VariaCardio TF5 system on a patient with a heart pacemaker or any other telemetrically (UHF range) programmable/controllable device. • If a patient connected to the VariaCardio TF5 system is to be defibrillated, the leads must be removed from the patient before defibrillation. • There are no user serviceable parts. • The operating UHF frequency range of 869.7 MHz (914.5 MHz USA only) used for wireless ECG/RR data transfer is considered for general industrial, scientific and medical use (‘ISM band’). Therefore, it might casually be possible that disturbance caused by another wireless device working on the same operating frequency occurs. This situation means in no way any hazard for patient. However, it might be necessary to use another operating frequency for your VariaCardio TF5 to work correctly. • User changes or modifications not expressly approved by AMDG/MIE could void the user’s authority to operate the VariaCardio TF5. Exclusions: • Do not store or operate the VariaCardio TF5 system in a sterile, wet, damp or dusty environment. • Do not use the system in areas with explosive and / or inflammable gases. • Do not store or operate the system in direct sunlight • Only use antennae provided with the VariaVardio TF5 system. Regulatory: • FDA: This instrument is a Class II, Type B Applied Part device. • CE: This device is a class 2a device with a measuring function. • Accuracy is ± 1ms R-R interval measurement (equivalent to ± 0.1%) • Suitable for…
Text truncated - open the document above for the full version.
Users Manual
(c) 2001-2003 Advanced Medical Diagnostics Group, Ltd Doc 125-05 31 5.11. License, Hardlock, Data Protection & Business Issues In order to maximally protect your sensitive data and the know-how of the system, a special programmable, hi-tech hardlock is to be connected when using the system VariaCardio TF5. This hardlock is connected with the PC via standard printer port that can be found on the back of the computer. A “free” version of the TF5 program – that does not require use of the hardlock -- allows browsing the pre-recorded demo data and its 3-D display & analysis only. All other practical steps in clinical use of TF5 require connection with the hardlock that includes license data specially pre-programmed for the individual user in order to allow her/him to make a maximum use of the system in accordance with her/his business model. Some relevant user-specific data (see below) are downloadable from the connected hardlock in the main menu section Engineering ‡ License. Important notice: Bear in mind, please, that programming the hardlock as well as adjustment of your TF5 system license conditions require – at least initially -- presence of AMDG or its authorised representative. Therefore, we strongly suggest you to consult any step regarding such license manipulations in advance. Otherwise, AMDG or its partners can not be held responsible for any direct in indirect damage potentially occurring in this respect. 5.12. How to Send Records and Protocols via E-mail Separate HRV records and/or complete examination protocols with comments can be sent in encrypted form in order to enable consulting the data with the Remote Analysis Centre and/or to facilitate delivery of the complete examination protocols to related subjects. To do this, it is necessary first to adjust the e-mail addresses for data exchange in the Engineering -> Program Setup -> Export/Send option: (c) 2001-2003 Advanced Medical Diagnostics Group, Ltd Doc 125-05 32 Then, select/mark the record to be sent - simply by moving the arrow at the left/hand side of the basic database screen (name of the subject in the upper part of the screen, individual record/s in the lower part). Afterwards, selected HRV data can be sent via a standard e-mail program (MS Outlook) by choosing option Database -> Send Record. Whenever connected to Internet, the data will be automatically sent to the address indicated in the Setup. 5.13. How to Export and Import HRV Records Using Database->Export Record or Import Record option it is possible to manipulate the selected record of chosen subject. This is typically done e.g. when the HRV record is to be further processed separately (export) or a record from a different database is to be imported into another one (import). The newly generated file can be found in the export directory as adjusted in the Engineering -> Program Setup -> Export/Send option. (c) 2001-2003 Advanced Medical Diagnostics Group, Ltd Doc 125-05 33 6. Clinical Use of the System: Measurements 6.1. Measurements: Spectral Test Measuring Screen In the basic operation screen, click on icon Measuring (or press CTRL + S or open Measuring option in the main program menu and select ‘Spectral test’). New screen Spectral test measuring is displayed with following main sessions: (1) Commands menu including submenu items Control, Save, Browse, Window and Exit. (2) Icons menu corresponding with the above, including additionally Start and Stop, Interval marking, Record ECG icons etc., for details see below. (3) Subject identification with ID, Surname and Date of birth items. (4) Hardware info shows the current quality of data transfer/ECG in left window and progress of heart rate over recent time in the right window. (5) Radio signal quality indicator, and Battery status show current state of these items. (6) Alert window below the radio signal and battery status indicators informs you of system configuration and of possible errors (e.g., alert ‘Receiver switched off...’). A strip with information “OK” shows normal setting, strip blinking in orange warns of errors and possible cause of the problem encountered is displayed. Furthermore, pre-defined user’s limits – in accordance with pre-set/prepaid service – and currently available number of TF5 test actions are shown. (7) Record ECG section contains data on ECG record length from pressing the CTRL + E hot keys or clicking on ECG record icon or pressing Record button, and information on total number of ECG records in this measuring session. The default setting ‘–10 / +20’ shows that from the event the previous 10 seconds and following 20 seconds are recorded (=30 seconds for each ECG record). The red button in this section shows ECG strip recording. (8) Artefact record section displays the number of artefacts and automatic artefact recognition state. The button when green indicates normal heart rate data, when red informs of automatically recognised and corrected artefacts (cardiac arrhythmia, movement artefacts e.g., while changing position from supine to standing). (9) Basic values window delivers exact numeric information on instantaneous R-R data: Pulse number, Length of R-R interval in [ms], Heart rate in [beats per minute] and Time elapsed since pressing Start button in [hrs:min:sec] (Note, please, that this total time differs from the “Time remaining” information in the section 10). (10) Statistic interval section is only active during recording the data for HRV analysis. Once Mark button is pressed, analysis interval count number is shown (normally 1 – 3, corresponding with examination procedure in 1-supine/2-standing/3-supine). Paralelly, countdown for Time and number of Pulses remaining starts from 300 downwards. (11) Measuring control buttons at the bottom of the window control program functions such as Start, Stop, Save, Browse (R-R data) and (Browse) ECG. 1 2 3 4 5 & 6 7 8 9 10 11 (c) 2001-2003 Advanced Medical Diagnostics Group, Ltd Doc 125-05 34 6.2. Measurements: How to Perform Measu…
Text truncated - open the document above for the full version.
Users Manual
(c) 2001-2003 Advanced Medical Diagnostics Group, Ltd Doc 125-05 47 frequency band with its very-low, low and high frequency over all recorded positions; units [ms 2 ]) representing the total averaged area under all consecutive spectral curves within the short-term recording is calculated • Standard deviations (units [%]): calculated for each parameter, as this information is necessary for assessment of the ‘stationarity’ of the examination. We recommend excluding any findings having more than 20- 30% relative deviation in any of the time segments recorded. In those cases, the examinations should be repeated Additionally, calculations of time-domain parameters are made, as well: ♦ Mean R-R interval (NN mean) ♦ Standard deviation of mean R-R interval (SDNN) ♦ MSSD (Mean of the squared differences between two adjacent normal R-R intervals over given recording period) It is possible to display the results in three different display options, as: (1) Three-dimensional running spectra graph (see Chapter 7.4. How to Perform the Analysis) (2) Statistical table (‘Numerical spectral results’) (3) Graphical form (‘Graphical spectral results’). Practical example: The figure above shows results options (2) and (3), based on normal cardiac autonomic control as obtained during modified orthostatic load: the numerical data displayed correspond with the above listed main outcome variables, the graphical output displays absolute values of spectral powers LF & HF in (three) examination intervals. It documents predominance of HF band (right column, in green) in supine -- intervals 1 and 3 -- and predominance of LF band (left column, in blue) in standing positions - - interval 2. (c) 2001-2003 Advanced Medical Diagnostics Group, Ltd Doc 125-05 48 7.4. Analysis. How to Perform the Analysis First select the subject for the analysis from the Subjects listing in the basic operation screen (see Chapter 5.4. Database: How to Find a Subject). Optionally, then open the Browser – click on icon -- and check the consistency of the R-R data, particularly with respect to artefacts. If artefact found, process it properly – see the Chapter 6.3.2. How to find and process artefacts. Bear in mind, please, that even one artefact might totally destroy the quality of information received over the total 15 minutes measurement. However, you can also directly progress to the 3D analysis: click on icon Frequency domain analysis or press CTRL + F together or in the main program menu open Analysis -> Frequency domain. Following Basic analysis screen is opened: 7.4.1. Basic Analysis Screen. 3D Running Spectra Graph Practical example shows a typical pattern obtained in a subject with no detected disturbances in cardiovascular autonomic control during a modified orthostatic test (lying down [T1] - standing up [T2] - lying down [T3], calculation for every position is based on 256 artefact-free data points; note that this display includes only low and high-frequency bands /range adjustable in the Engineering->Program Setup/). The graphics shows clearly a predominance of HF band (0.15-0.40 Hz) during supine positions (marked as T1 and T3) while LF band (0.05-0.15 Hz) gets ‘activated’ during standing-up (marked as T2). The numbers 1-8 are related to its detailed description, see below. 1 2 3 4 5 7 6 8 (c) 2001-2003 Advanced Medical Diagnostics Group, Ltd Doc 125-05 49 The standard Basic analysis screen of the measurements includes: (1) Windows heading includes subject’s last name, year of birth and recording time details of the record analysed. (2) Below, a line with Program sub-menu commands include options View (Statistical table or Graphical output), Resume (allows to write comments on the results), Output (Printing or Export of the results in text format) and Exit. (3) Icons enabling quick access to the most of above functions. (4) Two-dimensional spectral graph that shows single spectral curve created at specific time point – see the ‘slider’ at the right-hand side of the output screen. An instantaneous sympathovagal balance ‘online’ chart (is displayed right along the 2D spectral curve (blue & green bars). (5) The biggest part of the screen covers three-dimensional running spectra graph showing the behaviour of the autonomic cardiac control system during the whole examination. Note, please, that while this display shows the complete record including the changes of position etc., the final statistical results are based only on 0 - 300 seconds periods from pressing the marker in each position (see markers T1, T2 and T3). (6) Zoom control slider allows to adjust the size of the displayed graph. (7) Time control slider allows to ‘slide’ the graph while showing instantaneous spectral curve at specific time point (‘slice time’). This interval is displayed in [seconds] from the start of measurements (and not from pressing any of the markers!) below the slider. (8) View control pointer at the left lower corner below allows to adjust the view angle of the 3D graph in order to enable better overview over the results. Practical example: Below you can find some examples of 3D display manipulation using the ‘View control’ option, in order to obtain an optimum graphical overview of the autonomic control during the modified orthostatic test. (c) 2001-2003 Advanced Medical Diagnostics Group, Ltd Doc 125-05 50 7.4.2. Basic Analysis Screen. Statistical Table The results can be obtained in form of the Numerical spectral results table that is reached by clicking on the first icon in the Submenu commands line. The table is vertically divided into three sections covering 3 measurement intervals (supine/ standing/ supine). Horizontally, groups of parameters are shown where the most important information includes the (Spectral) Power variable, displaying power within specific frequency bands. Above in the Statistical table you can see results of short-term HRV spectral analysis as obtained in a normal subject (see also Chapter 7.3. HRV Basics): • Variables Po…
Text truncated - open the document above for the full version.
Users Manual
(c) 2001-2003 Advanced Medical Diagnostics Group, Ltd Doc 125-05 55 8.2.1. Ewing Battery: How to Perform the Deep Breathing Test The subject sits quietly on the examination bed, the thorax belt with integral electrodes is correctly positioned on the chest and the transmitter switched on (regular signals as indicated by the LED-diode are detected). Click on the Deep breathing test button (section 9 in the measuring screen). Enter the blood pressure value, if needed (optional). Then click on the ‘Test start’ button - - see below, the screen shows effect of a cyclical breathing on the heart rate course while voice and written / graphical commands help to guide the test appropriately: After an initial phase (10 seconds) that is necessary for obtaining basic data for statistics, a voice and written command “Breath in” appears, followed after 5 seconds by “Breath out” command. Paralelly, a breathing guide bar slowly increases and decreases in green so that the subject’s cyclical breathing excursions are maximally standardised, each of them 5 seconds (four inspirations and four exspirations). When finished (after 40 seconds), a message appears on the screen: “Breath normally”. Another 10 seconds of data are then recorded for computational purposes, a final longer beep and messages “Test is finished” indicate that the test is finished automatically. Important notice: the record must be absolutely artefact-free in order to ensure reliable test results. (See “Filtration“ procedure) (c) 2001-2003 Advanced Medical Diagnostics Group, Ltd Doc 125-05 56 After the measurement is finished, the following procedures/keys can be used: After any of the Ewing’s tests is finished, save, please, (by clicking on the ‘Save’ button below) the recorded data immediately. Afterwards, the patient’s record and identification information is displayed, as well as graphics displaying the heart rate course during the whole test and all relevant statistical results – click on the ‘Results’ button below. Relevant parameters: Deep breathing test HRrest : Resting heart rate MV: Average R-R interval SD: Standard deviation MSSD: Mean Square of Differences of Successive R-R Intervals CVr-r : Component Variance of R-R Intervals I-E: Difference Inspirium and Expirium heart rate I/E: Ratio maximum vers. minimum heart rate during Inspirium and Expirium Practical example: Typical results screen with apparently normal heart rate variability during the deep breathing test. For parameters description, see above. The green lines in the main screen show time course of test commands (5-seconds cycles), ECG below, position of the browser of heart rate course and numbers shown at the bottom line are related to the marked HR value – in yellow, see the main screen. In order to remove artefacts, the marking can be changed by moving the mouse and clicking the left (mark) or right (unmark) buttons. This procedure is identical with that used in spectral analysis processing, as described earlier. (c) 2001-2003 Advanced Medical Diagnostics Group, Ltd Doc 125-05 57 8.2.2. Ewing Battery: How to Perform the Valsalva Maneuver Choose the ‘Valsalva maneuver’ option by clicking the button. Optionally, enter the blood pressure values and start the measurement by clicking the ‘Test start’ button. After starting you have to wait for 10 seconds, after which a message ‘Breath in and blow into tube’ appears. Identical voice command is heard, as well. The patient has to inhale deeply, and when starting the exhalation (while reaching 40 mmHg on the manometer), the examiner has to press the ‘Pressure reached’ key. Under constant resistance of 40 mmHg during the expiration, the heart rate course is recorded for 15 seconds. Afterwards a short signal beeps, and a message ‘Release and breath normally’ appears, paralleled by a voice command. The subject returns to normal breathing and has to wait until the end of the test (some 20 seconds again). Finally, a message ‘Test is finished’ closes the examination. Please save the recorded data immediately, again, by clicking the ‘Save’ button below. Results of the test are available by clicking the ‘Results’ button below on the screen. Relevant parameters: Valsalva maneuver VR Valsalva-Ratio t max Timepoint of maximal heart rate t min Timepoint of minimal heart rate HRrest Resting heart rate HR max Maximal heart rate HR min Minimal heart rate HR max / HR rest Ratio maximal heart rate vers. rest HR max - HR rest Difference maximal heart rate minus rest HR min / HR rest Ratio minimal heart rate vers. rest (c) 2001-2003 Advanced Medical Diagnostics Group, Ltd Doc 125-05 58 Practical example: Above you can see a typical course of normal reaction of heart rate during the Valsalva maneuver (blue bars) as seen during the examination. Just a note, save always the obtained data as soon as possible to avoid unnecessary data loss etc. Notice: From experience, it is recommended to make three Valsalva tests, and to express the result (the Valsalva ratio) as the mean ratio from the three successive tests (for more details see also Ewing DJ: The Value of Cardiovascular Autonomic Function Tests: 10 Years of Experience in Diabetes; Diabetes Care, 1985, 5: 491- 498). 8.2.2. Ewing Battery: How to Perform the Orthostatic Test Whilst the subject is lying on the bed, measure his BP and – after choosing the ‘Orthostatic test’ option -- enter the values into the fields ‘Blood pressure before the test’. Click the ‘Start’ button and wait for 10 sec (see the description above). (c) 2001-2003 Advanced Medical Diagnostics Group, Ltd Doc 125-05 59 After this preparatory phase, a message ‘Stand up’ appears, paralleled by a voice command. After the subject finished the change of his position and is quietly standing, click the button ‘Standing position reached’. The subject stands until the automatic ending of the test. The examiner (repeatedly) measures the blood pressure throughout the test. It is highly recommended to enter the blood pressure values into th…
Text truncated - open the document above for the full version.
Cover Letter(s)
Tel: Fax: E-mail: Web: Reg: +44 (0)113 279 3710 +44 (0)113 231 0820 [email protected] http://www.mie-uk.com 1701634 Directors: Dr. M.I. Ellis, B.Sc., Ph.D., C.Eng Mrs. V. Ellis V.A.T. Number: GB 387 9339 85 Registered Office: 6 Wortley Moor Rd LEEDS West Yorkshire, LS12 4JF United Kingdom Federal Communications Commission Authorization and Evaluation Division Confidentiality Request regarding application for certification of FCC ID: HH4TF5-TX Pursuant to Sections 0.457 and 0.459 of the Commission’s Rules, we hereby request confidential treatment of information accompanying this application as outlined below: Operational theory Block diagram Schematic diagram Parts List The above materials contain trade secrets and proprietary information not customarily released to the public. The public disclosure of these materials may be harmful to the applicant and provide unjustified benefits to its competitors. The applicant understands that pursuant to Section 0.457 of the Rules, disclosure of this application and all accompanying documentation will not be made before the date of the Grant for this application. Sincerely,
Cover Letter(s)
TF5 Transmitter (TFT5 ver.1.0) Transmitting Antenna Assembly Please note: Change to transformation ratio now part of manufactured pro duct for compliance with FCC rules. Drawing Number : 180 Issue Number...2... Issue Date ...16.04.02............MIE Authorisation Signature & Date.............................................. 1mm
External Photos
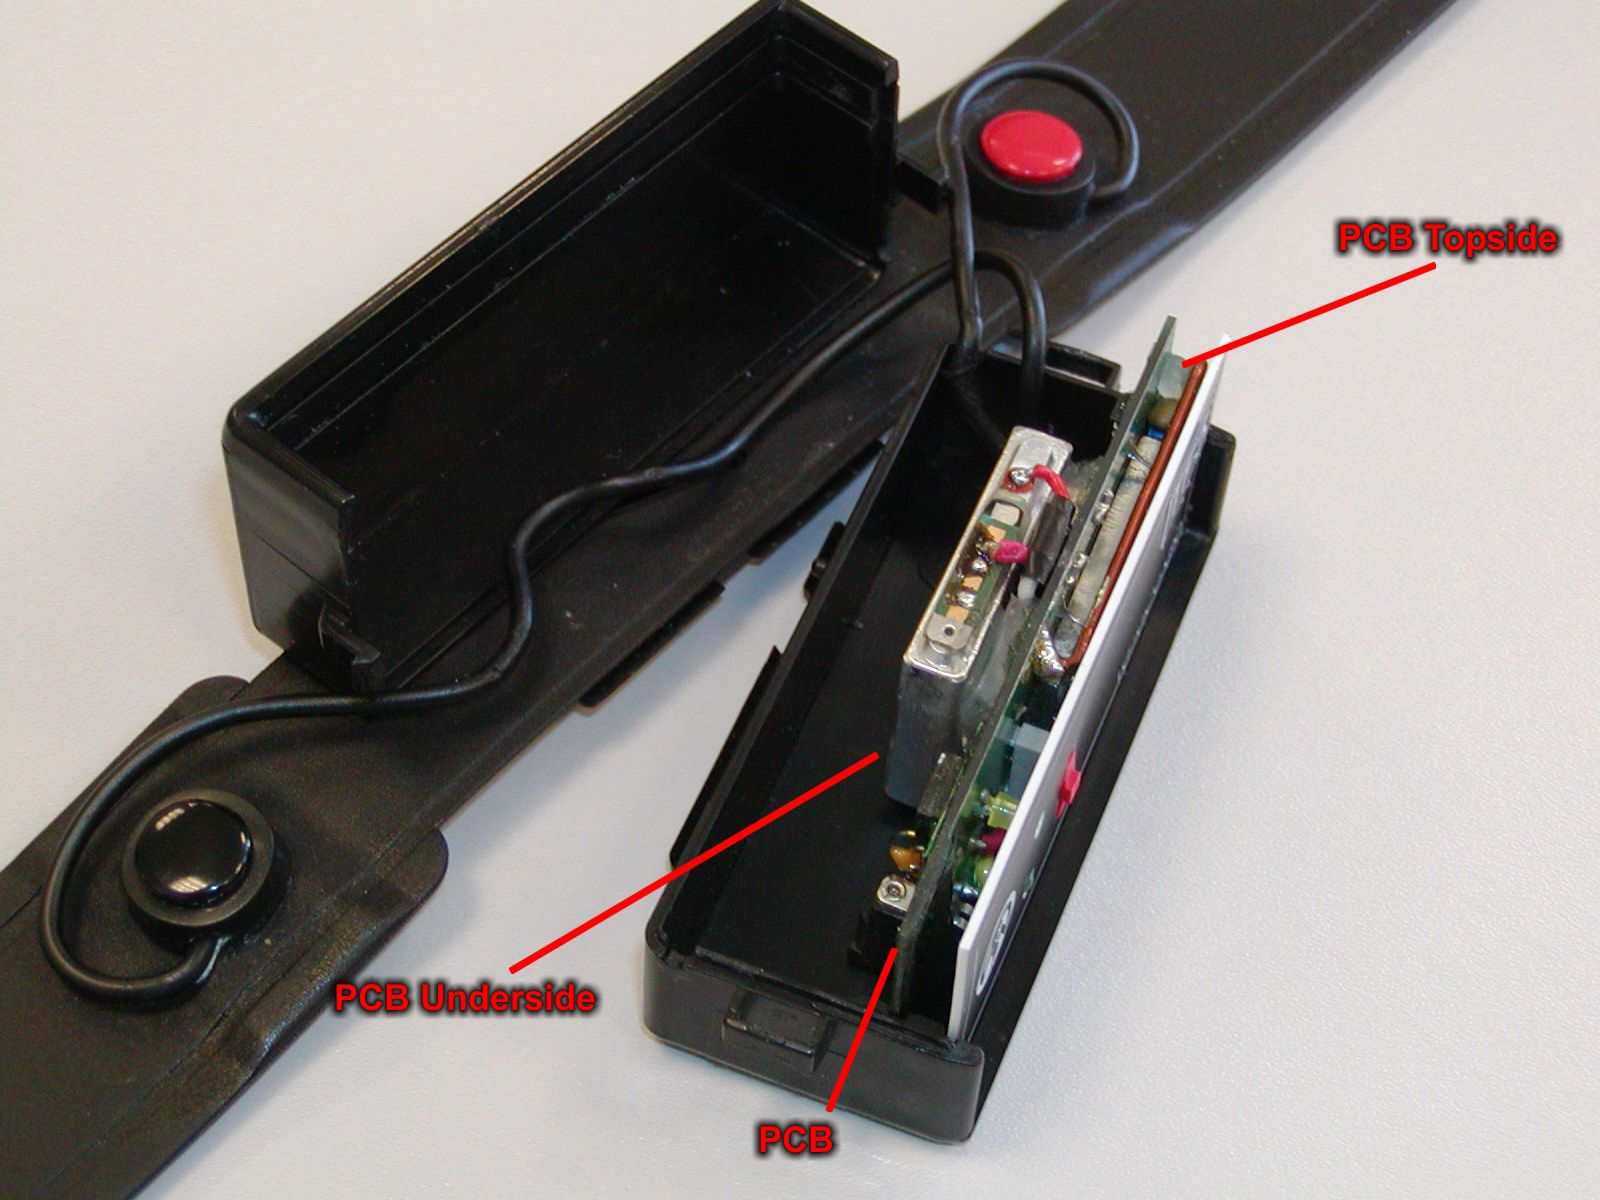
ExternalPhotoTransmitter
ID Label/Location Info
TF5 FCC ID Label Location
ID Label/Location Info
SerialNo: 12VDC/50mAFrequency:914.5MHz VARIACARDIOTF5-TRANSMITTER TestedToComplywith FCCStandard FCCCFR47,parts15.249 Forintentionalradiators TXFCCID:HH4TF5-TX FCCIDLabelArtworkforthe TF5Transmitter Title: DrawingNo.:0182IssueNo.:03IssueDate:15-MAY-2003 MIEAuthorizationSignature:...............................................
Test Report
SGS United Kingdom Ltd Unit 10, Bowburn South Industrial Estate, Bowburn, Durham DH6 5AD Tel +44 (0)191 377 2000 Fax +44 (0)191 377 2020 Registered in England No. 1193985 Rossmore Business Park, Ellesmere Port, Cheshire CH65 3EN www.sgs.com Member of SGS Group (Société Générale de Surveillance) Electromagnetic Compatibility Test of: Heart Rate Variability Monitor Model Number: TF5 Applicant: MIE Medical Research Ltd. Test Type: Compliance Test Specification: FCC CFR47 October 1999, parts 15.107, 15.109 for unintentional radiators, 15.207, 15.209 and 15.249 for intentional radiators SGS Serial Number: DUR23903/FCC/ST/02 Date of Receipt: 21 st February 2002, 24 th February 2003, 15 th May 2003 Date of Test(s): 26 th March 2002 – 26 th February 2003, 2 nd June – 4 th June 2003 Date of Issue: 4 rd June 2003 Issue Number: 3 This report refers only to the sample submitted for test. This report shall not be reproduced except in full without the written approval of the testing laboratory. Test EngineerAuthorised Signatory S. ThompsonA. Reynard Technical Manager TEST REPORT Page 2 of 19 Issue Date: 4 rd June 2003 SGS Serial Number: DUR23903/FCC/ST/02 Issue Number: 3 CONTENTSPage Number 1. Client Information ........................................................................................................................... 3 2. Details Of Test Laboratory............................................................................................................. 3 3. Equipment Under Test (EUT)......................................................................................................... 4 3.1 Identification Of EUT.................................................................................................................................................. 4 4. Test Specification, Methods and Procedures.............................................................................. 4 4.1 Test Specification(s) .................................................................................................................................................. 4 4.2 Purpose Of Test ........................................................................................................................................................ 4 4.3 Methods and Procedures............................................................................................................................................ 5 5. Deviations or Exclusions from the Test Specifications.............................................................. 6 6. Operation of the EUT During Testing / Configuration and Peripherals .................................... 7 6.1 Operating Mode and Environmental Conditions ......................................................................................................... 7 6.2 Configuration and Peripherals..................................................................................................................................... 7 7. Test Results .................................................................................................................................... 7 7.1 General Comments.................................................................................................................................................... 7 7.2 Modifications Made to the EUT.................................................................................................................................. 7 7.3 Summary of Test Results............................................................................................................................................ 8 7.4Conducted Emissions Test Results - Receiver ..................................................................... 9 7.5Conducted Emissions Test Results - Transmitter .............................................................. 12 7.6Radiated Emissions Test Results ......................................................................................... 15 TEST REPORT Page 3 of 19 Issue Date: 4 rd June 2003 SGS Serial Number: DUR23903/FCC/ST/02 Issue Number: 3 1. Client Information Company Name: MIE…
Text truncated - open the document above for the full version.
Contact Information
Applicant
A Mey
Test Firm
SGS United Kingdom Ltd.Stephen Thompson
Technical Specifications
| # | Rule Parts | Frequency Range | Power Output |
|---|---|---|---|
| 1 | 15C | 914.5 MHz - 914.5 MHz | - |
Other Applications from MIE Medical Research Ltd

HH4TF5-RX
Jun 23, 2003HEART RATE VARIABILITY MONITER
Equipment Class
CYY - Communications Receiver used w/Pt 15 TransmitterHH45SMMT8RX
Aug 04, 1988CYY - Communications Receiver used w/Pt 15 Transmitter
Equipment Class
CYY - Communications Receiver used w/Pt 15 Transmitter