OXZPV2000
Preco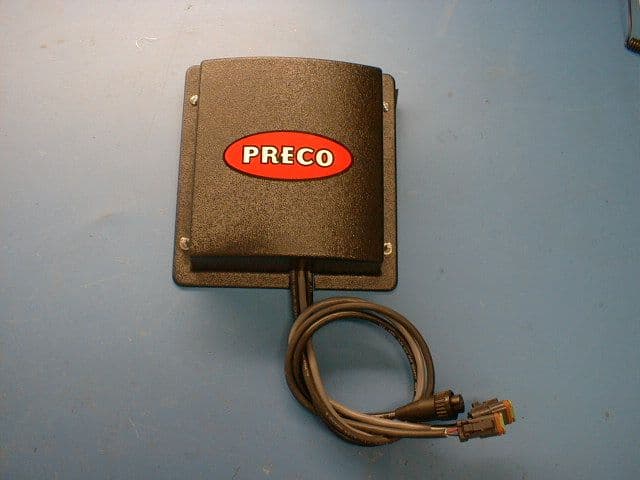
Click to zoom
Application Details
- Equipment Class
- FDS - Part 15 Field Disturbance Sensor
- Date of Grant
- Jul 11, 2000
- Application Purpose
- Original Equipment
- Date of Application
- Mar 22, 2000
- Frequency Range
- 5797.50000000 - 5797.50000000
- Company
- Preco
- Country
- United States
Documents & Files
Document Text
Text extracted from the exhibit documents filed with the FCC. Open a document above to read the original.
Users Manual
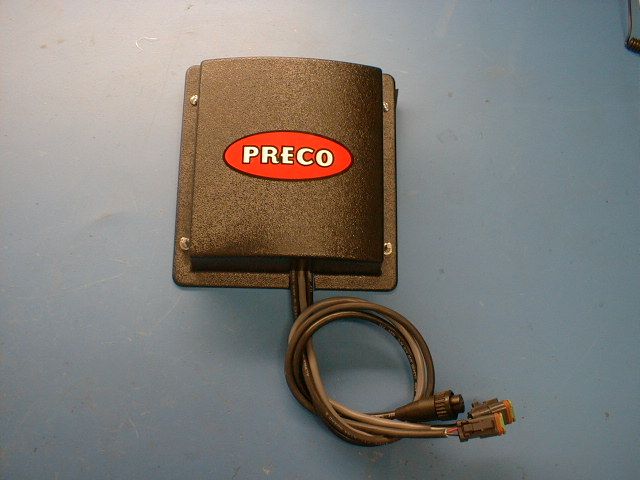
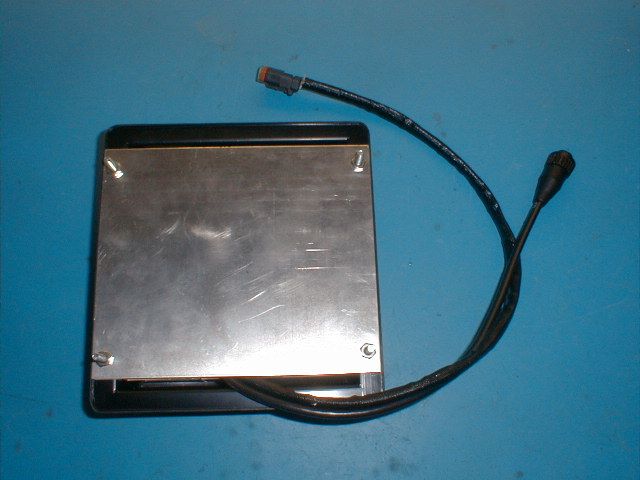
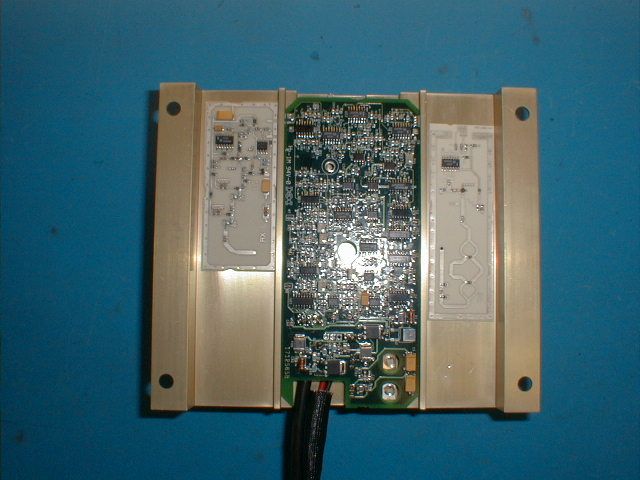
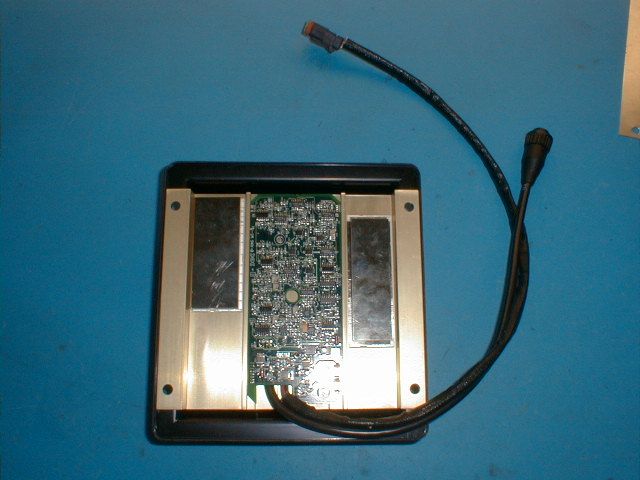
Preco Electronics Inc. PV2000 TIME DOMAIN RADAR PV2000 USER MANUAL CLYDE SHAVER 3-1-2000 INTRODUCTION This manual will discuss the installation and operation of Preco’s PV2000 Time Domain Radar. General radar and electro-magnetics theory will be left for the reader to pursue elsewhere. INSTALLATION The radar was designed to be mounted perpindicular to the ground at a height of 3 feet (ground to center of radar). Mount radar at the rear of the vehicle, in the center. If radar must be mounted at a height of less than 2.25 feet, then radar unit must be tilted Up aprox 5 degrees, to keep the ground from being detected. If radar is mounted at greater than 4 feet, then radar can be tilted down aprox. 5 degrees to avoid missing short Targets within the range. Connect the two conductor dc power connector to a dc supply of 9.6v-28volts. Connect the round connector on radar sensor to the extention cable that goes up to the cab of the vehicle, and connect LED box to extension cable. OPERATION The radar is designed to detect objects up to 8 meters(26.25 ft). The eight lights indicate How far target is from radar unit. When 1 light is on, a target has just entered the detection zone at 8meters away. When all 8 lights are on the target is within 1 meter of The radar sensor. The audible indicator also beeps faster as the target approaches. The radar was designed to meet SAE J1741, see spec. for zone parameters. The PV2000 has a detection zone that resembles a pear, see zone pattern plot. The vertical pattern is aprox. 20 degrees thruout the range and the horizontal is about 150 degrees at 0.5 meters, and about 45 degrees at 26 feet. RADAR DETECTION ZONE DIMENSIONS ARE IN METERS HORIZONTAL PATTERN VERTICAL PATTERN
Cover Letter(s)
From: Clyde Shaver Preco Inc. [email protected] To: Joe Dechoso Date: 4-28-00 Re: FCC ID OXZPV2000 731 Confirmation Number EA97146 In Response to Correspondence Ref. Number 13583 Date of Original E-Mail 4-21-2000 Dear Joe Dechoso, 1) See Attracted Confidential letter that list exhibits Preco wants held Confidential. 2) Preco’s PV2000 radar has a center frequency of 5.80 Ghz. The Pulse Repetition frequency is 5 Mhz. This radar was designed to meet FCC part 15 for Transmitters, by lowering the power Out of the transmitter to below the noise floor. (-54dB uV/Meter @ 3 meters) Transmitters below this level are considered to be a non transmission, and pose no Threat to any equipment in its proximity. We have compared our Transmit power level to other products, at the same frequency, And the same Pulse length (10-12 Nano seconds). We found our radar transmits the same or less energy than Sentrol Corp’s product that uses the same pulsed RF technology. HP Application note 150-2 contains the desense chart and parameters the determine is the Desense is applicable. We find that like the app. Note states, that if the PRF of the transmitter is less than the Video BW of the Spectrum Analyzer, the factor does not apply. We find that at the output power levels of our transmitter, even with a PRF of 10 Mhz does not require a Desense factor. At 1.25 Mhz or 2.5 Mhz or 5Mhz the output power Does not change and the factor does not apply. We attribute this to high dynamic range Spectrum Analyzer, and that until the power level reaches greater than 1mW the internal mixer does not go non linear, and the filters do settle and give accurate readings. HP produced an abstract named Pulsed-RF Measurements: Considerations in Using Spectrum Ana lyzers Author: Joe Gorin (R&D Engineer with HP. Abstract does not have a number, I only have this in hard copy form. If you don’t have this abstract, and would like a copy, please feel free To request it, and I can scan, or fax it to you. This 15 page abstract was presented at a RF & Microwave Measurement Symposium This abstract covers Spec. An considerations when measuring Pulsed-RF transmitters. Subjects covered Accuracy degradations: 1) Video-response errors 2) Dynamic-range Limitations 3) Misresponses to pulses 4) Time-domain aberrations. Measures of spectrum-analyzer performance: 1) Sensitivity-related figures of merit 2) Repeatability 3) Performance comparisons We concur in the lab with this abstract. Power levels measured into a HP 8590 series analyzer that are at or below –10dBm are not distorted power wise because of the dynamic range of the analyzer. Intertek Testing Services has been through these same measurements, and concur with these findings. Thanks for your time and Consideration 208 850-6510 cell 208 322-2444 office
Cover Letter(s)
415 N. Maple Grove • Boise, ID 83704-8241• Ph: 208.323.1000 • Fx: 208.323.1034 • http://www.preco.com/ June 21, 2000 Federal Communications Commission FCC Applications Processing Branch Attn: Joe Dichoso Subject: Preco Electronics Preview Radar PV2000, FCC ID OXZPV2000 Dear Mr. Dichoso; In your latest communication with us ref:14446 dated 8JUN00 you requested: 1. Clarification that only the schematics were to be held confidential. • Please hold the schematics confidential. The block diagram and theory of operations are not confidential. Thank you for helping us clarify these confidentiality issues. 2. A response to item #2 of your FAX ref:14289 dated 26MAY00 asking for Data on the carrier, 5.8 GHz and the harmonics; • Enclosed you will find PV2000 FCC 15.249 Radiated Emission data and graphs running the device CW, in Continuous Mode, rather than pulse with data at the fundamental, attached CW1, and first harmonic,attached CW2. Although Pulse Mode is the normal operation of this device we have included this CW information, as did Sentrol (FCC Identifier CGGAA2) in their application and subsiquent certification for the same frequency band and certification type of field disturbance sensor. This Continuous Mode data helps demonstrate that our device operates within Specification for both the Continuous Mode as well as Pulse (Modulated). Intertek Testing Services (ITS) concurs with this test method. • Also included is the page from our ITS test report that contains the measured harmonic content of the carrier, the measurements on both sides of the carrier, and the harmonics through 40000 MHz. This was extracted from our original test report Please refer to original data submitted on test report # J99032486b, test date of 1/11/2000 for additional harmonics FCC 15.249 Radiated Emissions. I have included the same Sentrol FCC 15.249 Radiated Emmissions data for reference and comparison. • 3. In response to your request to provide any supporting measurement information: • ANSI C63.4 -1992) Appendix H4 note between step 11 and 12. instructs one to refer to the test equipment manufacturer for proper measuring correction factors when measuring pulses. We called Agilent Technologies Measurement support group (formerly HP Test and Measurement) for spectrum analyzers to review the desensitization factor applicability. We were referred to Mr. Carlos Perez, a 31- year veteran Engineer specializing in spectrum analyzer measurements, as their “resident expert”. • In reference to HP Application Note 150-2 Spectrum Analysis Pulsed RF. On page 15 sentence 1, “There are several conditions which must be satisfied if equation (10) is to be valid.” Mr. Perez stated that all four conditions must be satisfied for the Pulse Desensitization Chart (Figure 28) to be applicable. In particular, condition 4. Peak amplitude at the mixer of the analyzer must stay below the 1 dB compression point of the analyzer (typically between –10dBm and –5dBm). • Our peak power at 5.8 Ghz in CW mode is less than –30 dBm. • Mr. Perez continued to clarify by saying that when the application note was first written (1971), the spectrum analyzers at the time had no warning mechanism to alert an operator, that he/she was exceeding the input power level at the spectrum analyzer input causing the input mixer or amplifier to saturate. Mr. Perez explained that if in doubt, whether or not an operator is over-driving the analyzer, the operator should decrease the input power into the analyzer by 10 dB, and observe the change in the reading. If the signal displayed only drops 9 dB, then the analyzer has reached the 1 dB compression point. (This is partial saturation). If the displayed reading goes down 10 dB, then one knows that the input power level into the analyzer is in the linear range, and the measurements displayed do not require any addition correction factor to be applied, because the analyzer is not in compression or partial saturation. • In reference to HP 150-2 Application Note, page 17, first paragraph, if we keep input signal levels at or below –10dBm (assuming this is the 1 dB compression point), we are the limited only by the sensitivity of the analyzer. This is the point that Mr. Perez was trying to emphasize. The last sentence of the application note says, ”The new generation of HP spectrum analyzers offers exceptionally high sensitivities which allow measurements of extremely short RF pulses” This is the case now, and even then (1971), as long as you don’t saturate the analyzer and you have sufficient display range (30 dB in our case). • Mr. Perez is available as a resource to discuss the Application Note 150-2 interpretation with the FCC. His telephone number is (800) 452-4844. 4. Based upon the data taken by ITS, close review of when to apply desensitization, and prior decisions by the FCC, as demonstrated in Sentrol’s certification CGGAA2, we do not believe the application of 26 dBm correction factor is appropriate in this case. Both Intertek Testing Services and HP’s expert concur with this view. The following materials are included in this response. 1. FCC15.249 Radiated Emissions, 1/11/2000,ITS #J99032486 2. FCC15.249 Radiated Emissions, 7/02/1998,ITS #J98018757, Sentrol CGGAA2 (REF only) 3. CW1.JPG Carrier in CW mode 5800 MHz 4. CW2.JPG Harmonic in CW mode 5800 MHz 5. FCCDATA. XLS CW data Please contact us if you would like to discuss this matter further. Respectfully, Dale Hessing Director of Engineering
ID Label/Location Info
1) MATERIAL: 3-5 mil VINYL OR POLYESTER BASE. 1-2 mil CLEAR POLYESTER OVERLAMINATE. 2) ADHESIVE: PRESSURE SENSITIVE BACKED, SUITABLE TO APPLICATION. W/ KRAFT OR COATED TYPE PEEL-OFF COVERING. 3) COLOR: ALL TO BE UV STABILIZED. BLACK IMAGERY/LETTERING. WHITE BACKGROUND/MEDIA. 4) IMAGERY LETTERING, EXCEPT LOGOS: A = 5.0 pt HELVETICA 5) APPLICATION: EXTERIOR AUTOMOTIVE. (TEMPERATURE, HUMIDITY, UV, CAUSTICS, PETROLEUM, ETC.) 6) PACKAGING: 3" ID CORE ROLL STD, UNLESS SPECIFIED OTHER PER P/O. 7) COPY POSITION: #2 OR #3 PREFERRED. 8) DIE BLANK SIZE: 0.87" X 1.44" BASIC W/ 0.06" CORNER RADII. 9) HOLES: NONE. FCC ID: OXZPV2000 This device complies with Part 15 of the FCC Rules. Operation is subject to the following two conditions: (1) This device may not cause harmful interference, and (2) This device must accept any interf- erence received, including interference that may cause undesired operation. 0.87" FINISHED 1.44" FINISHED A SIZE: SHEET: OFSCALE: FILE: REV:P/N DATE: TITLE/DESC PROJ:CHKD: JT 1 11=1 5067991A.CDR 02-24-00 415 N. MAPLE GROVE BOISE, IDAHO 83703 (208) 323-1000 - PRECO PROPRIETARY TECHNICAL DATA FURNISHED HEREIN SHALL NOT BE EITHER RELEASED, USED, DUPLICATED, OR DISCLOSED IN WHOLE OR IN PART FOR MANUFACTURE OR PROCUREMENT WITHOUT THE WRITTEN PERMISSION OF PRECO ELECTRONICS TOLERANCES -UNLESS OTHERWISE NOTED- DIMENSIONS PER ANSI Y14.5M-1982 X.X = +/-0.1 X.XX = +/-0.03 X.XXX = +/-0.005 X.XXXX = +/-0.XXXX = +/-0.5 O ENGLISH -DO NOT SCALE DRAWING- THIRD ANGLE PROJECTION LABEL - FCC ID MODEL - PD2000 A506-799-1 JP PRECO ELECTRONICS PRECO, INCORPORATED A DIVISION OF A DRWN: B A C 231 3 B A C 21 - JP CHK - JT DRN - A REVDESCRIPTION REVISIONS - XXXX PCO# - 02-24-00 DATE - APPROVAL PROOF
Parts List/Tune Up Info
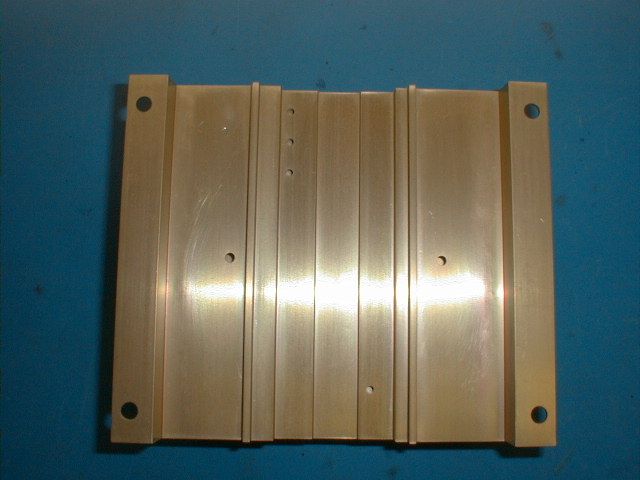
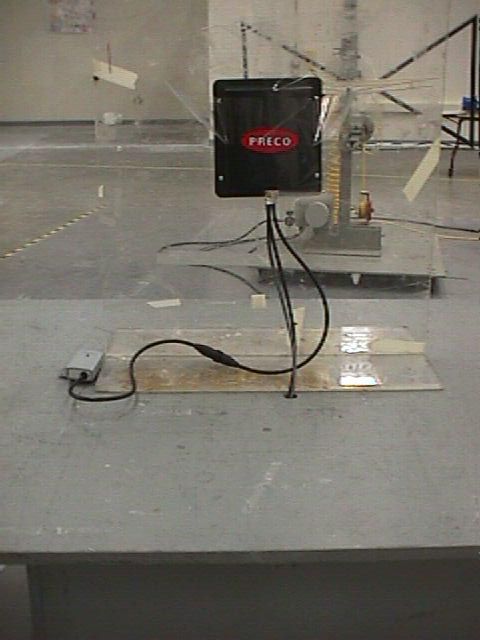
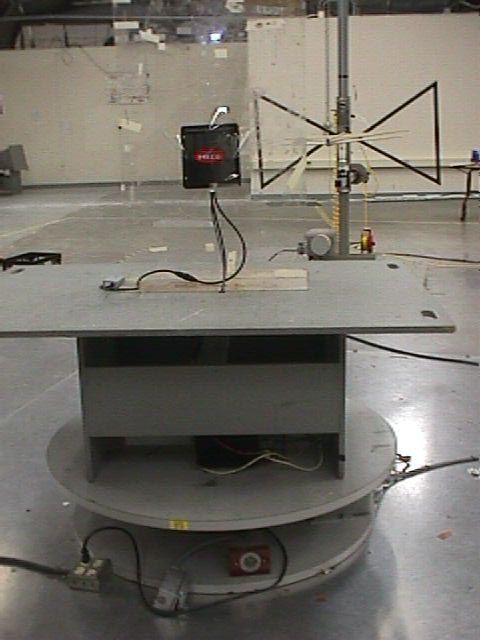
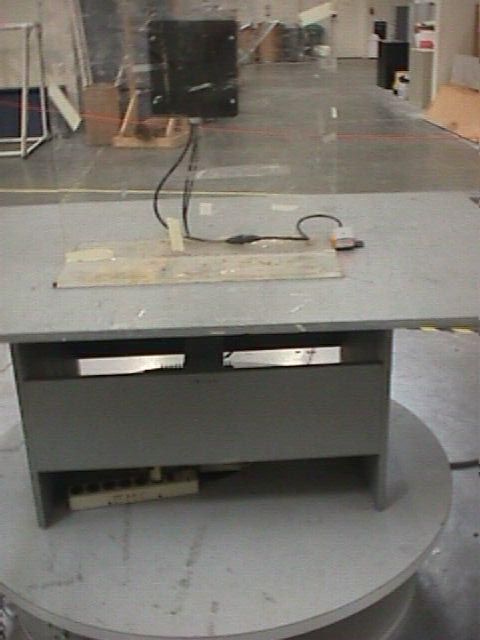
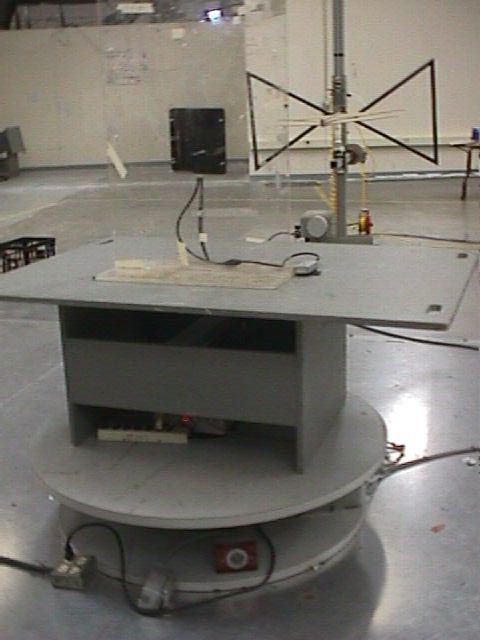
Preco Electronics Process Specification PV2000 transmitter alignment for frequency and amplitude. 1. SCOPE 1.1 This proceedure is to define the alignment of the PV2000 back up alarm transmitter for center frequency and amplitude. 2. PURPOSE 2.1 The purpose of this proceedure is to ensure proper alignment of the transmitter section of the PV2000 back up alarm. 3. RESPONSIBILITY 3.1 It is the responsibility of R&D Engineering to create, maintain and update this specific document. 4. EQUIPMENT REQUIRED 4.1 HP 8596EM EMC Analyzer or equivelent. 4.2 EMCO Model 3115 horn antena or equivilent. 4.3 Pyrimid 13.8 VDC power supply or equivilent. 4.4 R.F. cable rated for 5.8 GHz . 4.5 Preco built alignment table. 5. DEFINITIONS 5.1 Alignment stub. 5.1.1 A small piece of copper stock .0015in thick, .0500in wide, and lengths varying from .0500in to .3000in. 6. PROCEDURES 6.1 Alignment. 6.1.1 Place PV2000 in recessed area on top of alignment table with the fins pointing toward the hor n a ntena.. 6.1.2 Connect the EMCO horn antena and the HP 8596EM EMC Analyzer wit the R.F. cable, and locate the horn antena in the cabinet of the alignment table pointing up. 6.1.3 HP 8596EM EMC Analyzer settings. 6.1.3.1 Spectrum analyzer mode. 6.1.3.2 Center frequency, 5.8 GHz. 6.1.3.3 Frequency span, 3.0 GHz. 6.1.3.4 Amplitude, auto. 6.1.4 Power up unit 6.1.5 Place alignment stubs on the transmitters printed circuit board and optomize the output signal to a center frequency of 5.8 GHz ± 25 MHz and an amplitude of –41 dbm.
Parts List/Tune Up Info
SYMBOLSCHARACTERISTICS UNITS MIN TYP MAX VDSDrain to Source Voltage V 2 3 I DDrain Current mA 10 20 PinInput PowerdBm 0 FEATURES • SUPER LOW NOISE FIGURE: 0.45 dB TYP at 12 GHz • HIGH ASSOCIATED GAIN: 12.5 dB TYP at 12 GHz • GATE LENGTH: ≤ 0.20 μm • GATE WIDTH: 200 μm • LOW COST PLASTIC PACKAGE C to KU BAND SUPER LOW NOISE AMPLIFIER N-CHANNEL HJ-FET NE325S01 PART NUMBERNE325S01 PACKAGE OUTLINES01 SYMBOLSPARAMETERS AND CONDITIONSUNITSMINTYPMAX NF 1 Noise Figure, VDS = 2 V, ID = 10 mA, f = 12 GHzdB0.450.55 GA 1 Associated Gain, VDS = 2 V, ID = 10 mA, f = 12 GHzdB11.012.5 IDSSSaturated Drain Current, VDS = 2 V, VGS = 0 VmA206090 g mTransconductance, VDS = 2 V, ID = 10 mAmS4560 VGS(off)Gate to Source Cutoff Voltage, VDS = 2 V,ID = 100 μAV-0.2-0.7-2.0 IGSOGate to Source Leak Current, VGS = -3 VμA0.510 Associated Gain, G A (dB) Noise Figure, NF (dB) NOISE FIGURE & ASSOCIATED GAIN vs. FREQUENCY ELECTRICAL CHARACTERISTICS (TA = 25°C) Frequency, f (GHz) California Eastern Laboratories RECOMMENDED OPERATING CONDITIONS (TA = 25°C) PRELIMINARY DATA SHEET Note: 1. Typical values of noise figures and associated gain are those obtained when 50% of the devices from a large number of lots were individually measured in a circuit with the input individually tuned to obtain the minimum value. Maximum values are criteria established on the production line as a "go-no-go" screening tuned for the "generic" type but not each specimen. 1.0 0.5 0 12 46810142030 4 8 12 16 20 24 V DS = 2 V I D = 10 mA Ga NF DESCRIPTION The NE325S01 is a Hetero-Junction FET that uses the junction between Si-doped AlGaAs and undoped InGaAs to create very high mobility electrons. Its excellent low noise figure and high associated gain make it suitable for commercial systems and industrial applications. NEC's stringent quality assurance and test procedures assure the highest reliability and performance. NOISE FIGURE, ASSOCIATED GAIN vs. DRAIN CURRENT Noise Figure, NF (dB) Drain Current, ID (mA) Associated Gain, G A (dB) NE325S01 ABSOLUTE MAXIMUM RATINGS 1 (TA = 25°C) SYMBOLSPARAMETERSUNITS RATINGS VDSDrain to Source VoltageV4.0 VGSGate to Source VoltageV-3.0 IDDrain CurrentmAIDSS IGGate CurrentμA100 PTTotal Power DissipationmW165 TCHChannel Temperature°C125 T stgStorage Temperature°C-65 to +125 TOTAL POWER DISSIPATION vs. AMBIENT TEMPERATURE Ambient Temperature, TA (°C) Total Power Dissipation, P T (mW) Drain Current, I D (mA) TYPICAL PERFORMANCE CURVES (TA = 25°C) Note: 1. Operation in excess of any one of these parameters may result in permanent damage. Maximum Stable Gain, MSG (dB) Maximum Available Gain, MAG (dB) Forward Insertion Gain, IS 21S l 2 (dB) Drain Current, I D (mA) DRAIN CURRENT vs. GATE TO SOURCE VOLTAGE Frequency, f (GHz)Gate to Source Voltage, VGS (V) MAXIMUM AVAILABLE GAIN, FORWARD INSERTION GAIN vs. FREQUENCY DRAIN CURRENT vs. DRAIN TO SOURCE VOLTAGE Drain to Source Voltage, VDS (V) 250 200 150 100 50 50100150200250 0 100 80 60 40 20 01.53.0 VGS = 0 V -0.2 V -0.4 V -0.6 V -0.8 V 60 40 20 0 -2.0-1.00 V DS = 2 V 24 20 16 12 8 4 124 68 10142030 IS 21sl MSG. MAG. V DS = 2 V I D = 10 mA 2 VDS = 2V f = 12 GHz Ga NF 0 0.5 1.0 1.5 2.0 14 13 12 11 10 102030 NE325S01 TYPICAL COMMON SOURCE SCATTERING PARAMETERS (TA = 25°C) VDS = 2 V, ID = 10 mA FREQUENCYS11S21S12S22KMAG 1 (GHz)MAGANGMAGANGMAGANGMAGANG(dB) 2.00.969-24.844.798152.650.02673.020.574-18.450.23722.661 2.50.957-30.874.756146.030.03268.770.566-22.990.27721.721 3.00.944-36.914.730139.490.03864.980.556-27.480.31020.951 3.50.926-43.104.699132.750.04460.810.544-32.030.35820.286 4.00.906 -49.434.663126.040.05056.760.531-36.560.40319.697 4.50.884-55.584.600119.310.05552.640.515-41.220.45419.224 5.00.852 -62.024.523112.420.06048.770.496-45.750.52418.773 5.50.819-68.284.449105.800.06444.730.475-50.420.59518.421 6.00.785-74.484.37099.620.06841.160.454-55.090.65918.080 6.50.753-80.824.27693.420.07237.540.434-59.780.71617.737 7.00.723-87.004.20087.180.07534.030.414-64.500.77117.482 7.50.696-93.234.13681.150.07830.600.396-69.090.81617.245 8.00.670 -99.644.06675.300.08127.440.379-73.800.85417.007 8.50.643-105.784.01169.030.08424.340.363-78.310.89416.790 9.00.622-112.383.96863.040.08721.180.347-82.720.91916.591 9.50.597-119.183.92056.930.09018.070.330-87.240.95016.390 10.00.571-126.733.85750.480.09214.850.308-91.890.99516.225 10.50.538-134.313.79944.200.09411.580.287-96.771.04714.743 11.00.503-142.423.74038.290.0968.350.262-102.631.10013.983 11.50.475-150.843.62132.040.0985.110.237-109.341.15613.284 12.00.453-160.323.54525.990.0991.780.214-116.891.20012.834 12.50.435-170.103.48220.110.101-1.210.191-126.441.22712.500 13.00.422179.933.42314.370.102-4.530.173-137.471.25512.220 13.50.413169.883.3628.030.103-7.660.160-149.761.27811.970 14.00.408159.683.3091.700.104-11.000.151-161.841.29411.771 14.50.405149.303.250-4.800.106-14.390.145-174.451.30211.572 15.00.406138.943.182-11.370.107-17.920.144171.721.31611.364 15.50.410128.313.108-18.010.108-21.800.148157.821.33011.155 16.00.418117.543.031 -24.470.109-25.410.154142.641.34310.940 16.50.434106.982.943-30.700.110-29.360.168127.261.35010.739 17.00.45596.842.869-37.110.111-33.170.188114.011.34410.619 17.50.48487.212.799-43.550.111-37.060.214102.681.33010.577 18.00.52177.712.720-50.100.111-41.230.24692.621.30310.591 Coordinates in Ohms Frequency in GH z VDS = 2 V, IDS = 10 mA ∞ 2.0 18 GHz 18 GHz 1.0 0.5 - 0.5 - 1.5 - 2.0 0 S22 2 GHz S11 2 GHz +90° -90° +45° -45° +135° -135° +180°0 S21 2 GHz S12 2 GHz 18 GHz 18 GHz MAG = Maximum Available Gain MSG = Maximum Stable Gain Note: 1. Gain Calculation: MAG = |S 21| |S 12| K - 1 ). 2 (K ± ∆ = S 11 S22 - S21 S12 When K ≤ 1, MAG is undefined and MSG values are used. MSG = |S 21| |S 12| , K = 1 + | ∆ | - |S 11| - |S22| 2 2 2 2 |S12 S21| , ParametersQ1 ParametersQ1 VTO-0.8RG3 VTOSC0RD2 ALPHA8RS2 BETA0.103RGMET0 GAMMA0.092KF0 GAMMADC0.08AF1 Q2TNOM27 DELTA1XTI3 VBI0.715EG1.43 IS3e-13VTOTC0 N1.22BETATCE0 RIS0FFE1 RID0 TAU4e-12 CDS0.13e-12 RDB5000 CBS1e-9 CGSO0.3e-12 CGDO0.02e-12 DELTA10.3 DELTA20.1 FC0.5 VB…
Text truncated - open the document above for the full version.
Test Report
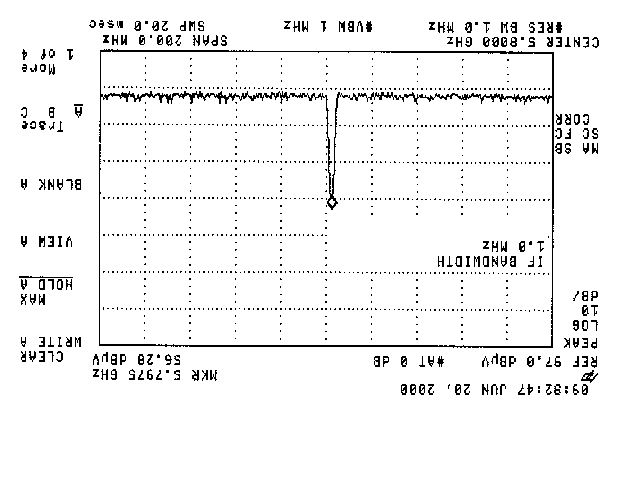
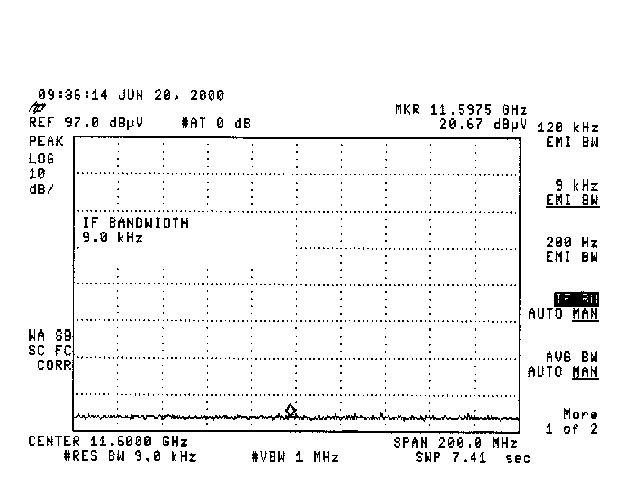
CompanyPreco Inc. ModelPV2000(CW mode)Note: Pulse mode is normal operation for this device. Date6/20/00 CW results are not required, but are provided FYI. Engineer Clyde Shaver FCC 15.249 Radiated Emissions FrequencyAntennaReadingAntenna CablePre-ampDutyCorrectedLimitMargin PolarityFactorLossCycleReading MhzH/VdB(uV)dBdBdBdBdB(uV/m) dB(uV/m)dB 5797.5H56.2834.83.00.020.074.0894.0-19.92 11597.5H20.6739.04.10.020.043.7754.0-10.23 Note:1. All measurements were made at 3 meters. 2. Negative signs (-) in the margin column signify levels below the limit. 3. See plots on the following pages. 4. Reading at 11597.5 Mhz was less than 20.67, see plot. EquipmentHP8593EM Spectrum Analyzer ( 9Khz--12.8Ghz ) Emco Model 3115 Double-Ridged Waveguide Horn Antenna Equipment calibration data, and certifications available upon request. Fccdata.xls
Contact Information
Applicant
Dale Hessing(Chief Technical Officer)
Technical Contact
Intertek Testing ServicesDavid Chernomordik
[email protected]650/463-2900
1365 Adams Ct. · Menlo Park, California · United States
Non-Technical Contact
PrecoClyde Shaver
[email protected]208/323-1000
Technical Specifications
| # | Rule Parts | Frequency Range | Power Output |
|---|---|---|---|
| 1 | 15.249 | 5.80 GHz - 5.80 GHz | - |
Other Applications from Preco
OXZSTAL79
Feb 19, 2026Vehicular Radar
Equipment Class
VRD - Part 95 Vehicular Radar Systems
OXZSENTRY79
May 11, 2023Field Disturbance Sensor
Equipment Class
VRD - Part 95 Vehicular Radar Systems
OXZPCLK2020
Jul 01, 2021PRECOlink
Equipment Class
DTS - Digital Transmission System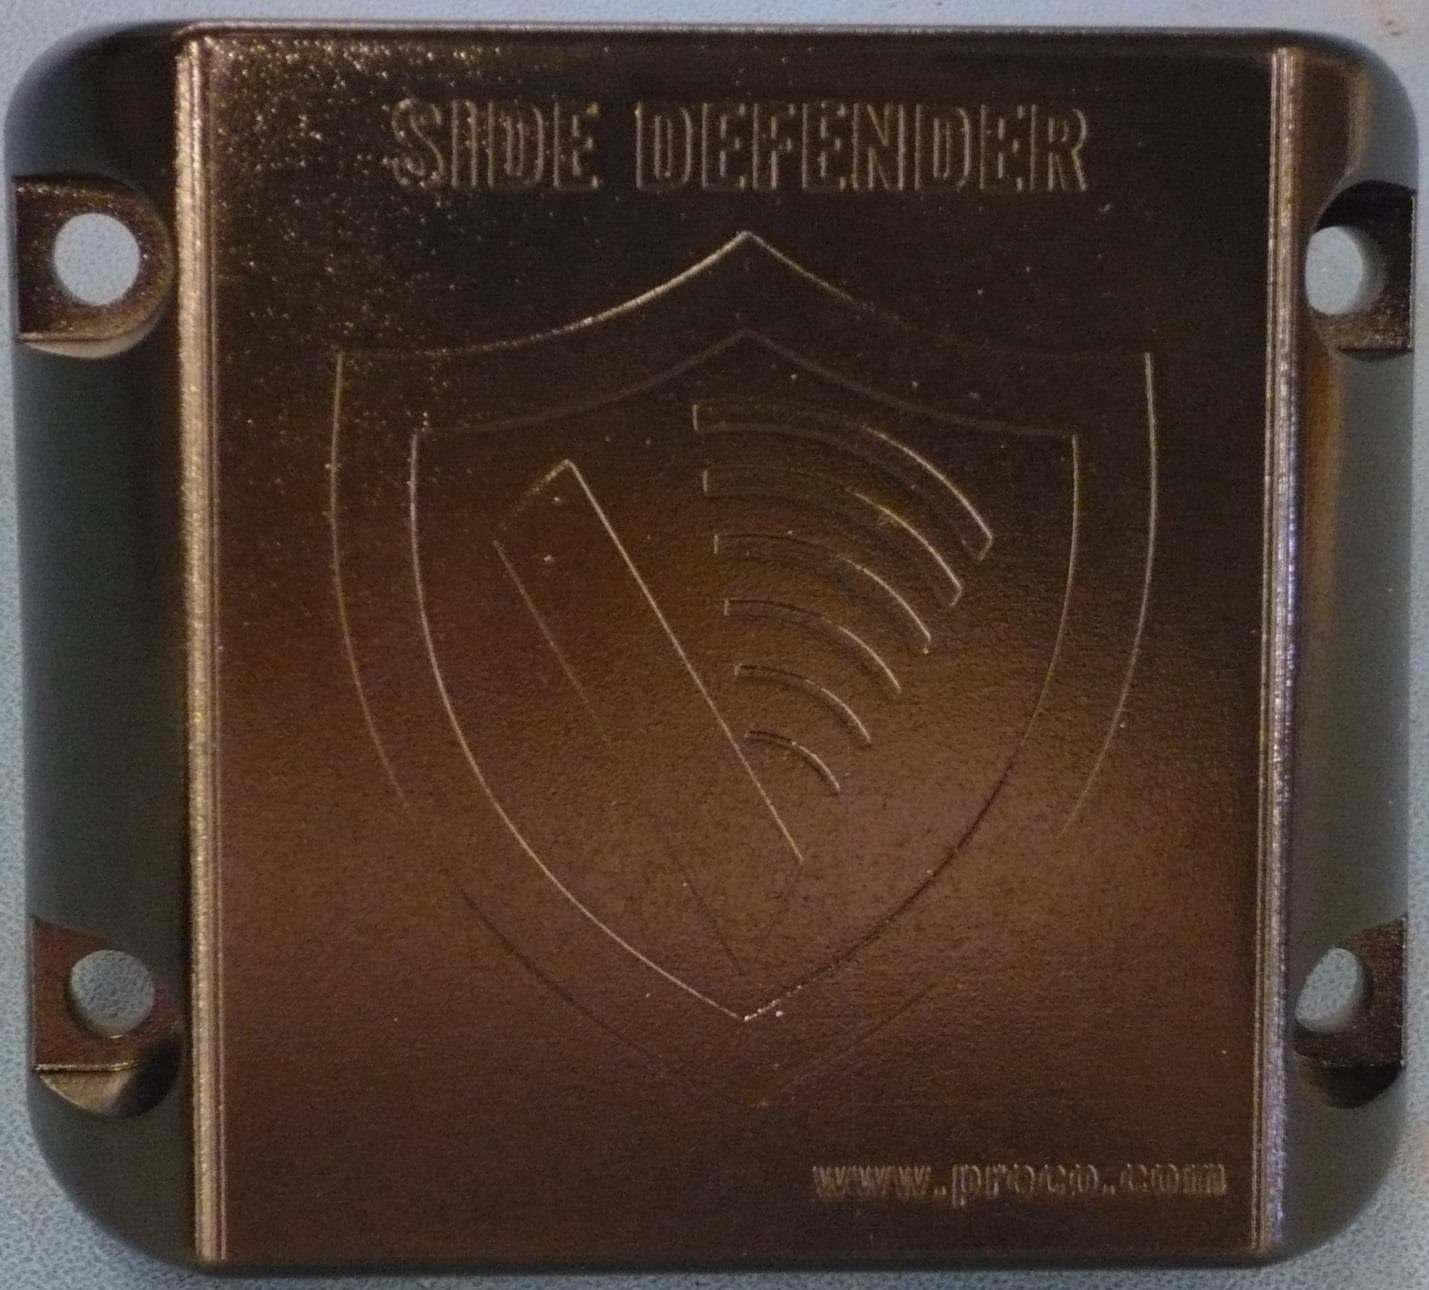
OXZSTNB2019
Apr 01, 2020PreView Sentry SX97
Equipment Class
DXX - Part 15 Low Power Communication Device Transmitter
OXZTHUN2019
Apr 01, 2020PreView Sentry ST97 and Side Defender II SDII97
Equipment Class
DXX - Part 15 Low Power Communication Device Transmitter