L2C0004TRVehicle Radar System
APTIV Services US LLC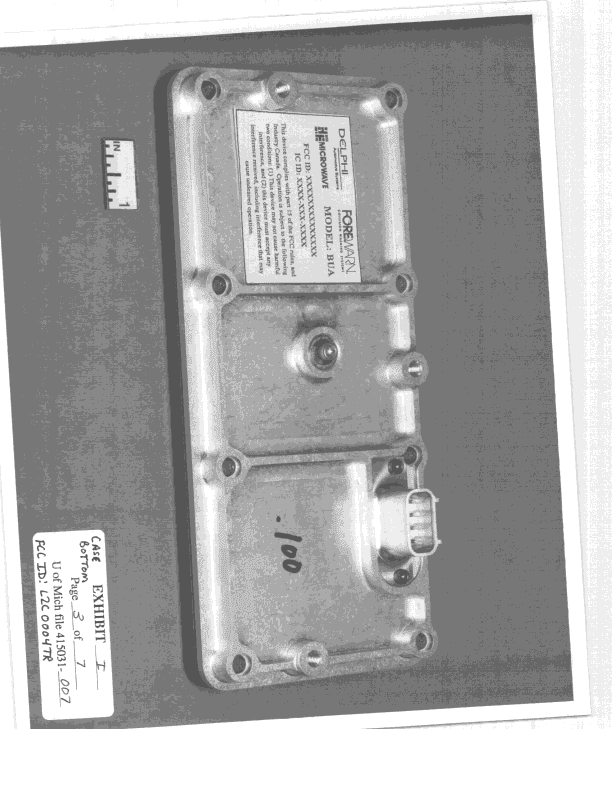
Click to zoom
Application Details
- Equipment Class
- DXX - Part 15 Low Power Communication Device Transmitter
- Date of Grant
- May 31, 2000
- Application Purpose
- Original Equipment
- Date of Application
- Jul 11, 1999
- Equipment Note
- Vehicle Radar System
- Frequency Range
- 16950.00000000 - 16950.00000000
- Company
- APTIV Services US LLC
- Country
- United States
Documents & Files
Document Text
Text extracted from the exhibit documents filed with the FCC. Open a document above to read the original.
Operational Description
H E MICROWAVE PROPRIETARY H E MICROWAVE PROPRIETARY TECHNICAL MEMORANDA Calculation of “Necessary Bandwidth” for Pseudo Noise Bi-Phase Modulated (Direct Sequence) Spread Spectrum Radars J. C. Reed October 22, 1999 ______________ J. C. Reed H E MICROWAVE PROPRIETARY October 22, 1999page 2 H E MICROWAVE PROPRIETARY 67962 Table of Contents INTRODUCTION....................................................................................................................................................... 3 NECESSARY BANDWIDTH CRITERIA ............................................................................................................... 3 R ANGE RESOLUTION IN PN CODED DIRECT SEQUENCE RADAR................................................................................ 3 Radiated Spectrum .............................................................................................................................................. 3 System Response – Cross Correlation Function.................................................................................................. 5 Interpretation of Cross Correlation Functions – Radar Range Resolution ........................................................ 6 COMPUTATION OF NECESSARY BANDWIDTH ..............................................................................................7 C ASE 1 – APPLICATION OF A 680 MHZ BAND PASS FILTER....................................................................................... 7 C ASE 2 – SPECTRAL SIDELOBE ELIMINATION............................................................................... 8 CONCLUSION .......................................................................................... 10 REFERENCES .......................................................................................... 10 H E MICROWAVE PROPRIETARY October 22, 1999page 3 H E MICROWAVE PROPRIETARY 67962 Introduction This memoranda addresses the computation of the radiated bandwidth required by a pseudo- noise (PN) bi-phase modulated (direct sequence) precision ranging radar. Of interest is the amount of bandwidth required, or what is “necessary” bandwidth. This note defines “necessary” for the case of precision ranging radars, shows that spectral components lying outside the “necessary bandwidth” do not contribute to system performance, and computes performance degradation for one case where the radiated bandwidth used is less than the necessary bandwidth. Necessary Bandwidth Criteria It is well known in general, regardless of the waveform type used, that range resolution in radars is inversely proportional to radiated bandwidth. 1 Range resolution in radars herein refers to the ability of the radar system to distinguish the presence of two targets which are closely spaced in range from the presence of one target at a particular range. The amount of range separation between two (otherwise identical) targets required for the radar to determine the presence of two objects as opposed to one is the quantitative measure of “range resolution”. Herein, the performance requirements made of the BUA radar regarding range resolution are used to define the meaning of “necessary bandwidth” in the application. It simply remains to quantify the minimum amount of frequency span required in the radiated transmission to achieve a particular range resolution capability given the nature of the waveform modulation in the BUA radar. Range Resolution in PN Coded Direct Sequence Radar Radiated Spectrum The radar at hand (Back Up Aid radar) uses bi-phase modulation where the modulating waveform is a serial digital bit stream that is pseudo-noise in nature. The example radar studied here uses a PN code of length 8191 bits. The radiated signal power spectral density of this type of modulation is given by 2 H E MICROWAVE PROPRIETARY October 22, 1999page 4 H E MICROWAVE PROPRIETARY 67962 G BPSK (f)=P s T b sin[π(f−f o )T b ] π(f−f o )T b 2 (1) where T b =the PN sequence bit period = 1.47 nsec in the example f o =the carrier frequency. This is shown in figure 1 for the case of a 17 Ghz carrier with a bit modulation rate of 680 Mhz. As indicated by eq. (1), the spacing between the spectral nulls seen in figure 1 is governed by the modulating bit rate which is the inverse of the bit period. The mainlobe null-to-null frequency span is twice the modulation bit rate. Each spectral sidelobe has a null-to-null bandwidth of the modulating bit rate. 1516171819 frequency, Ghz -25 -20 -15 -10 -5 0 r e w o p , b d power spectral density of a bi-phase modulated carrier Figure 1. Power spectral density of a bi-phase modulated carrier. The modulation bit stream is random or psuedo-random in nature. H E MICROWAVE PROPRIETARY October 22, 1999page 5 H E MICROWAVE PROPRIETARY 67962 System Response – Cross Correlation Function The system response to target range is governed by the bit rate of the modulation. Thus there is a direct one to one correspondence between spectral width and system range bin response, as expected. Specifically, the system response vs. target range for a single range bin is shown in figure 2. The example response is for range bin # 16, where internal time delays applied to the correlation receiver code correspond to 16 bit periods in the PN code. Each range bin in the system has a base width of 2 T b in time, where range bin width here is characterized by the differential propagation delay from a target as it changes range. The response in figure 2 is shown in terms of units of range bins. Figure 2. System receiver relative output vs target range delay. The system internal PN code, used for correlation, is delayed 16 code bits. The internal code delay determines the position of the range bin in distance from the radar by the delay of the internal code used for correlation. When the transmitted radiation time of flight delay to and from the target matches the internal code H E MICROWAVE PROPRIETARY October 22, 1999page 6 H E MICROWAVE PROPRIETARY…
Text truncated - open the document above for the full version.
Test Report
April 14, 2000 Mr. Greg Czumak [email protected] FCC Application Processing Branch Reference: FCC ID L2C0004TR, Applicant: Delphi Delco Electronics Systems, Correspondence Reference Number: 12255, 731 Confirmation Number: EA95105, (Back-up Aid Radar Sensor) Dear Mr. Czumak: The Delphi Delco Back-Up Aid Radar is a new safety feature designed to be used on vehicles in various short range applications including Backup Object Detection, Blind Spot Object Detection, Short Range Autonomous Cruise Control Stop and Go, and Pre- Crash. The purpose of this device is to signal a driver backing up at low speed (such as backing out of a driveway) that there is an object in his/her way in time for the driver to stop the car. Existing technology for this purpose relies upon ultrasonic sensors, which are limited in range and environmental performance. These ultrasonic sensors can operate only up to 2 meters in range and do not provide adequate warning to drivers backing up at low speeds of only 3 mph. The Delphi Delco sensor will advance public safety by replacing the functionality of ultrasonic sensors in these applications and offering extended ranges of performance. Specifically, for the Back-Up Aid application, a range of six meters is needed to allow for standard driver reaction times during typical backing maneuvers up to 10 mph. This allows the systems to not only inform the driver about the distance to known objects, but can warn the driver about unknown objects with time to react. Delphi Delco believes its radar sensor is compliant with all of the FCC regulations. The sensor design accounts for radiation limits on average radiated power as measured in a 1 MHz bandwidth; peak instantaneous radiated power, and potential carrier leakage emissions. Special design features are incorporated to assure emission compliance. There is a bandstop filter in the transmitter output to suppress unmodulated carrier emissions (carrier leakage), the modulation employed is designed to assure average power limits are not exceeded. Attenuators are used in the transmitter output to assure compliance with rule 15.35(b) and 15.209 Delphi Delco has considered the comments made in your e-mail dated February 18th regarding rule 15.35(b) and provides both analysis and data to show the Back Up Aid Radar Sensor is compliant. Your correspondence points out that the EUT waveform and a pulse train modulated waveform have the same power spectral density curves. Delphi Delco Mr. Greg Czumak April 14, 2000 Page 2 Product Regulations M/C: 480.009.T10 1401 Crooks Rd. Troy, MI 48084-2683 Tel: [1] 248.696.4436 FAX: [1] 248.696.5150 believes that applying a pulse train analysis to the spectrum analyzer readings from the EUT is inappropriate. The two waveforms have fundamentally different characteristics, phase modulation vs. amplitude modulation and continuous wave emission vs. time dependent emission. As a result, the two waveforms interact with the spectrum analyzer in different ways. The subject of the enclosed analysis is the relationship between a spectrum analyzer response and the total radiated power (or “peak” power) of a direct sequence spread spectrum signal as used by the EUT. This analysis showed that the total radiated power for the waveform and circuit design is 24 dB above the power measured on the spectrum analyzer using a 1 MHz resolution bandwidth. The sensor was initially measured using the spectrum analyzer 1 MHz resolution bandwidth method. The resulting E-field at 3 meters is 45.5 dBuV/m. This result is compliant with the limit of 54 dBuV/m specified in rule 15.209 (See enclosed in the attachment). Delphi Delco then measured the sensor using a peak power meter. Test and measurements of the radar sensor in conformance with the peak detection method of 15.35(b) are fully described in the attachments. The measurement result was an E-field of 71.9 dBuV/m at 3 meters. This result is consistent with the analysis and is compliant with the limit of 74 dBuV/m specified in rule 15.35 (b) (See enclosed in the attachment). Regarding your question from 1/15/00, “can the spreading function be disabled, so that measurements can be made on the unmodulated carrier”, Delphi Delco has disabled the spread spectrum modulation on a test sensor and conducted measurements on the unmodulated waveform. The modulation was disabled in such a manner as to bias the modulator in an “on”state. The measurement result was an E-field of 69.7 dBuV/m at 3 meters. This value is in compliance the limit of 74 dBuV/m at 3 meters specified in rule 15.35(b) (See enclosed in the attachment). (Note that the modified unit has all internal components functional and biased at the normal operating levels except the modulator is biased into a single “on” state.) The analysis, test set-ups, a list of test equipment used including calibration dates, and the test results are attached. Delphi Delco appreciates and fully supports the dialogue concerning our application. It is our intent as always, to fully comply with the letter and spirit of the Mr. Greg Czumak April 14, 2000 Page 3 Product Regulations M/C: 480.009.T10 1401 Crooks Rd. Troy, MI 48084-2683 Tel: [1] 248.696.4436 FAX: [1] 248.696.5150 regulations. Delphi Delco welcomes an opportunity to have further dialogue in a technical meeting with the FCC if it is so desired. Regards, Michael J. McKale Manager Product Regulations [email protected]
Test Report
BACKUP AID RADIATED EMISSIONS AND METHOD OF TEST 3-29-00 2 TABLE OF CONTENTS PAGE Equipment Used ............................................................ 3 Equipment Characterization ................................................ 3 Effective Aperture .......................................................... 3 Spectrum Analyzer Meas. SN-9105 ....................................... 4 Peak Power Analyzer Meas. SN-9105 ................................... 5 Demodulated BUA Radar SN-2002 ...................................... 6 CTT Amplifier w/wo Cable data ......................................... 7 CDI 3ft. Coax Cable data .................................................. 8 Spectrum SN-9105 data ................................................... 8 Spectrum SN-2002 data ................................................... 9 Total Power SN-9105 data ................................................ 9 3 Equipment Used MANUFACTUREMODEL/TYPEDATE CALIBRATED Hewlett Packard83630A Synthesizer6-99 Hewlett Packard6632A Power Supply6-99 Hewlett Packard6624A Power Supply12-99 Hewlett Packard8991A Peak Power Analyzer2-00 Hewlett Packard84813A Peak Power Sensor2-00 Hewlett Packard438A Power Meter12-99 Hewlett Packard8485D Power Sensor7-99 Hewlett Packard8563E Spectrum Analyzer6-99 Hewlett Packard8510C Network Analyzer12-99 Narda639 Standard Gain Horn17.6dBi @ 17Ghz Narda4609 WG to Coax Adapter-0.3dB insertion loss CTTAFM/180-3530 Amplifier35.7dB gain @ 17Ghz CDI3 ft Semi Flex Coax -2.7 dB insertion loss @ 17Ghz Equipment Characterization The HP8510C Network Analyzer was used to characterize the CDI 3ft. Semi Flex Coax Cable and the CTT Amplifier. Both the coax and amp were swept from 5-25Ghz, together and separate. At 17Ghz the amplifier has a gain of 35.7dB and the cable has an insertion loss of –2.7dB, an additional –0.3dB will be used for insertion loss of the WG to Coax Adapter. The HP83630A Synthesizer and 438A power meter were used to verify the amplitude measurements of the HP8563E Spectrum Analyzer. A known signal amplitude at various frequencies were set using the power meter and verfied on the Spectrum Analyzer to within 0.5dB. (well within calibration limits) The HP8991A Peak Power Analyzer was connected to the amplifier to measure the SNR. With the amplifier OFF the noise floor of the Peak Power Analyzer measured –34.4dBm. The amplifier ON condition raised the noise floor to –32.4dBm. Therefore:-32.4dBm= .57μW Shall be reduced from the signal + noise measurement. Effective Aperture of Narda 639 Standard Gain Horn Gain @ 17Ghz = 17.6dbi () 23 2 76.1 2 /10434.1 4 0177.10 4 mx G A r e − === ππ λ 4 Spectrum Analyzer Measurement SN-9105 Narda SGH dBiG r 6.17= 23 /10434.1mxA e − = 35.7dB Coax Cable –2.7dB WG to Coax Adapter –0.3dB 3.0meters Spectrum Analyzer settings Reference Level –30dBm5dB/divAtten 0dBCenter Freq. 16.950Ghz Span 1.0GhzRBW 1.0MhzVBW 10KhzSWP 250ms Trace was set to MAX HOLD then the DUT went through several slow rotations in all directions to capture all possible signal at 3 meters away. Marker PEAK SEARCH was then pushed to find maximum. MKR display read 16.805Ghz –66.08dBm. () () mVdBmV mVxE mpW mx dBm mx dBm A p dBmdBdBdBdBmP radm e r rad r /5.45188log20/188 /188101.94120 /1.94 /10434.1 10 /10434.1 7.98 7.987.23.07.350.66 12 3 23 87.9 23 μμ μπηω ω == === == − == −=++−+−= − − − − RESULT: The radiated emissions are 8.5dB below the limit of 54dBμV/m. D U T Power Supply 8v-dc Spectrum Analyzer -66dBm 5 Peak Power Analyzer Measurement SN-9105 To measure Total Instantaneous power Narda SGH dBiG r 6.17= 23 /10434.1mxA e − = 35.7dB WG to Coax Adapter –0.3dB 1.0 meter Peak Power Analyzer settings Reference Level –20dBmScale 2dB/divTime Base 50μsec/div Bandwidth LowCarrier Freq. 17Ghz DUT was 1.0 meter from SGH and rotated to achieve a peak signal on the Peak Power Analyzer display. The displayed data read –26.16dBm includes noise from the amplifier. Under Equipment Characterization the noise from the amplifier was calculated to be 0.57μW. Therefore: The corrected displayed reading should be –26.16dBm = 2.42μW –0.57μW = l.85μW = -27.3dBm. () () mVdBmVE mVxE mnW mx dbm mx dBm A P dBmdBdBdBmP m radm e r rad r /9.713958log20/3958 3 11874 /1187410374120 /374 /10434.1 10 /10434.1 7.62 7.623.07.353.27 3 9 1 23 27.6 23 μμ μπηω ω ==== === == − == −=+−+−= − − − − RESULT: The radiated Total Instantaneous emissions are 2.1dB below the Limit of 74dBuV/m. Power Supply 8v-dc D U T Peak Power Analyzer -26.2dBm Peak Power Senso r 6 Demodulated BUA Radar SN-2002 Demodulation was accomplished by cutting traces to pins 54 & 55 of the ASIC, and changing resistors R35 & R36 (which bias the modulator) from 20 ohm to 210 ohm 1/8w. R36 was tied to ground and R35 had 5v applied. Normally only 1v is applied but no longer available which in turn required a resistor change. Narda SGH dBiG r 6.17= 23 /10434.1mxA e − = 35.7dB Coax Cable –2.7dB 3.0meters WG to Coax Adapter –0.3dB Spectrum Analyzer settings Reference Level –30dBm5dB/divAtten 0dBCenter Freq. 16.9823Ghz Span 100MhzRBW 1.0MhzVBW 10KhzSWP 50ms Trace was set to MAX HOLD then the DUT went through several slow rotations in all directions to capture all possible signal at 3 meters away. Marker PEAK SEARCH was then pushed to find maximum. MKR display read 16.825Ghz –41.83dBm. () () mVdBmV mVxE mnW mx dBm mx dBm A P dbmdBdBdBdBmP radm e r rad r /7.693052log20/3052 /3052107.24120 /7.24 /10434.1 10 /10434.1 5.74 5.747.23.07.358.41 9 3 23 45.7 23 μμ μπηω ω == === == − == −=++−+−= − − − − RESULT: The radiated emissions of the demodulated radar are 4.3dB below the limit of 74dBuV/m Power Supply 8v-dc Spectrum Analyzer -41.8dBm D U T 7 CTT AMPLIFIER WITH 3Fft. COAX CTT AMPLIFIER MODEL # AFM/180-3530 8 CDI 3ft. SEMI-FLEX COAX CABLE MODULATED BUA RADAR 3 meter MEASURMENT SN-9105 9 DEMODULATED RADAR 3meter MEASURMENT SN-2002 MODULATED BUA 1 meter MEASURMENT SN-9105 TOTAL INSTANTANEOUS POWER
Contact Information
Applicant
Brian W Johnson(Engineering Group Manager)
Technical Contact
University of Michigan/EECSValdis V. Liepa
[email protected]734 647-1792
1301 Beal Avenue, Room 3242 · Ann Arbor, Michigan · United States
Non-Technical Contact
University of Michigan/EECSValdis V. Liepa
[email protected]734 647-1792
Technical Specifications
| # | Rule Parts | Frequency Range | Power Output | Tolerance |
|---|---|---|---|---|
| 1 | 15C | 16.95 GHz - 16.95 GHz | - | % |
Other Applications from APTIV Services US LLC
L2CSRR6PS
Apr 09, 2024SRR6PS
Equipment Class
VRD - Part 95 Vehicular Radar SystemsL2C0093TR
Mar 12, 2024Wireless Charging Module
Equipment Class
8CC - Part 18 Consumer Device
L2C0090TR
Oct 04, 2023Passive entry Keyless Go with tire pressure and door handle monitoring radio frequency module
Equipment Class
DCD - Part 15 Low Power Transmitter Below 1705 kHz
L2C0089TR
Jun 05, 2023FO3-TR903BDA
Equipment Class
DSC - Part 15 Security/Remote Control Transmitter
L2C0084TR
Jul 27, 2021Wireless Power Transfer Charger
Equipment Class
8CC - Part 18 Consumer Device