PHLVEGAUHF BROADCAST TRANSMITTER
Elettronika S.r.l.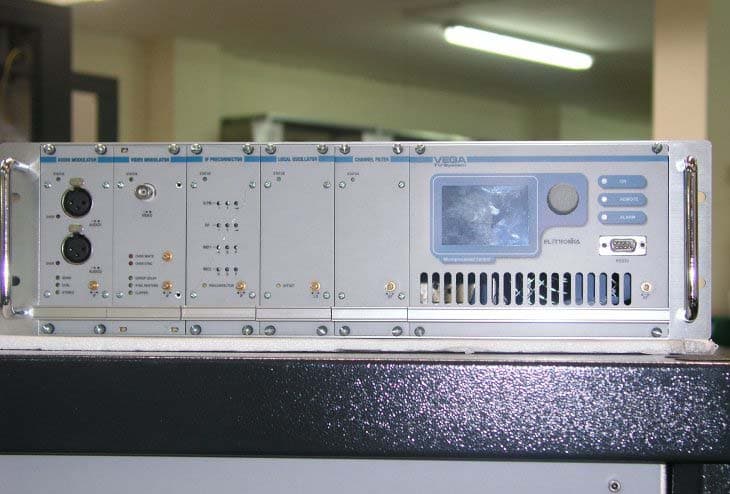
Click to zoom
Application Details
- Equipment Class
- TBC - Licensed Broadcast Station Transmitter
- Date of Grant
- Mar 16, 2005
- Application Purpose
- Original Equipment
- Date of Application
- Feb 01, 2005
- Equipment Note
- UHF BROADCAST TRANSMITTER
- Frequency Range
- 470.00000000 - 806.00000000
- Company
- Elettronika S.r.l.
- Country
- Italy
Documents & Files
Document Text
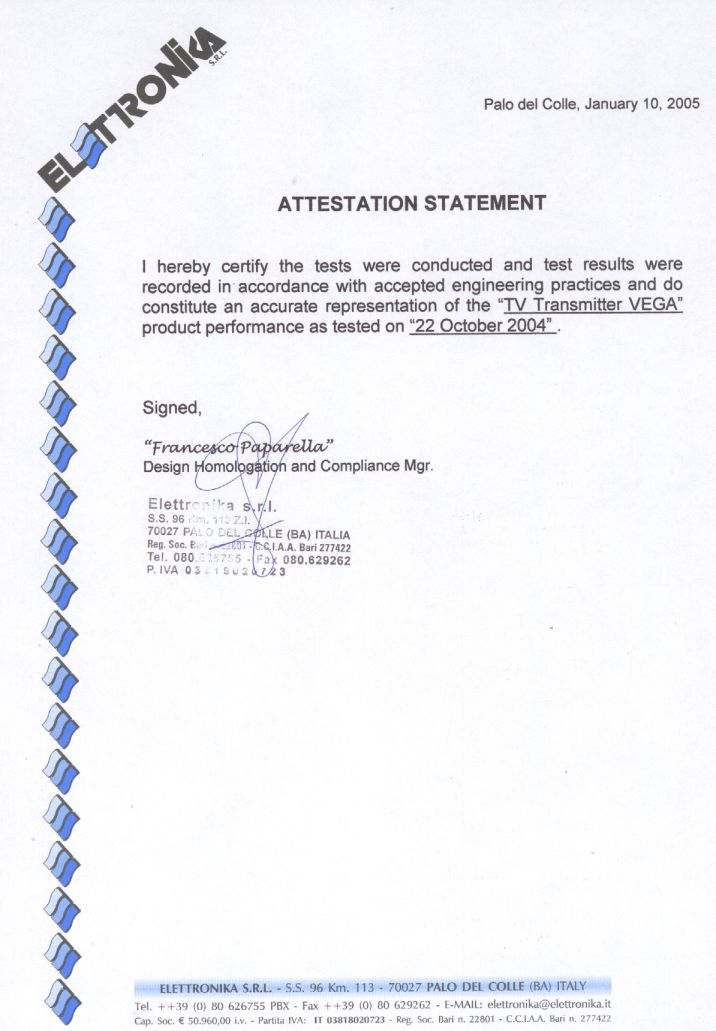
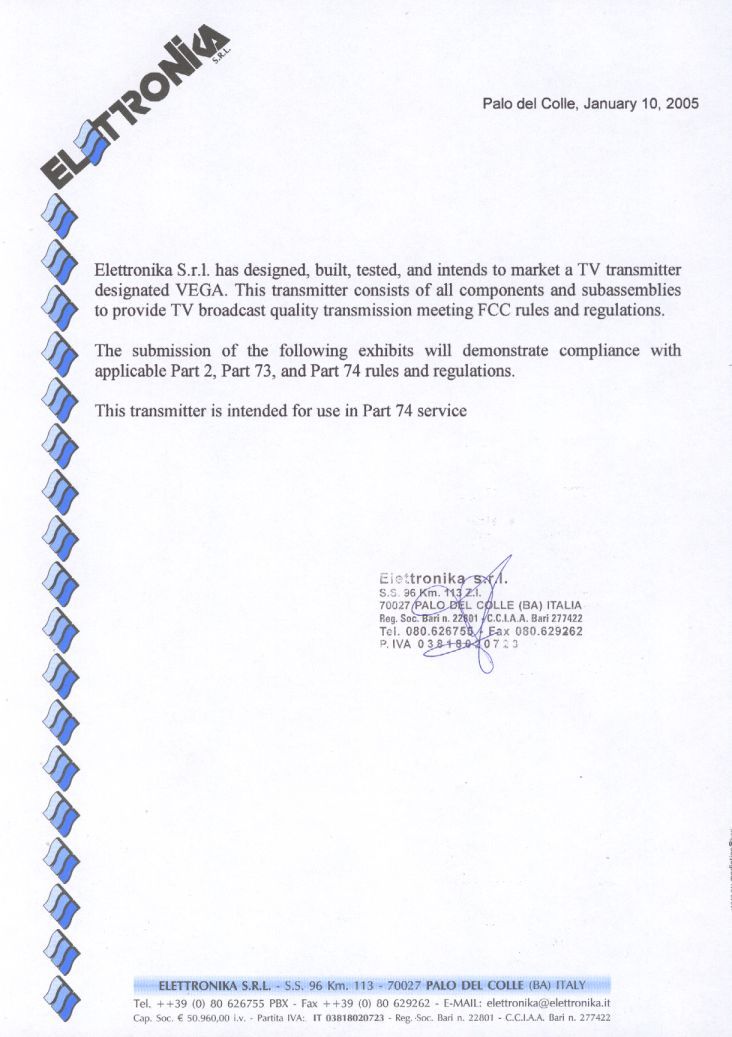
Text extracted from the exhibit documents filed with the FCC. Open a document above to read the original.
External Photos
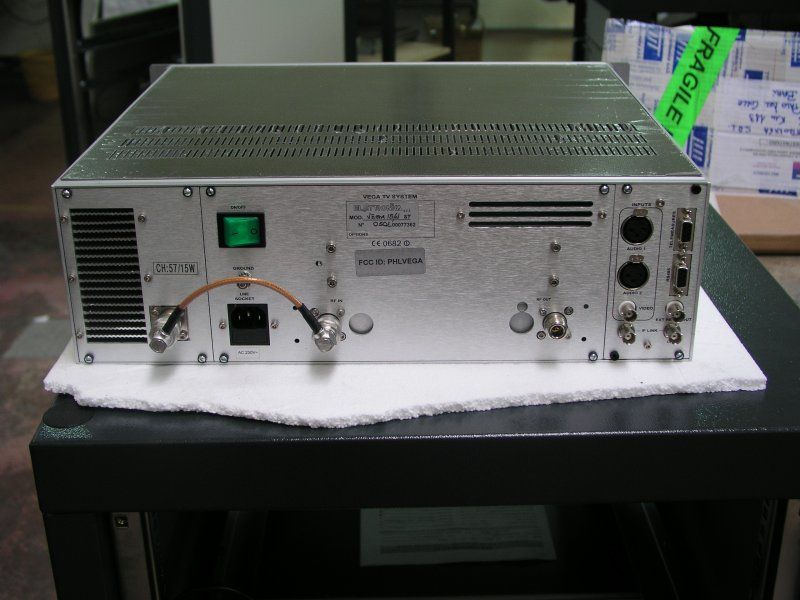
VEGA EXTERNAL CONSTRUCTION PHOTOS FRONT VIEW TOP VIEW FROM LEFT TOP VIEW FROM RIGHT TOP FRONTAL VIEW REAR VIEW TOP LEFT REAR VIEW TOP RIGHT REAR VIEW
Internal Photos
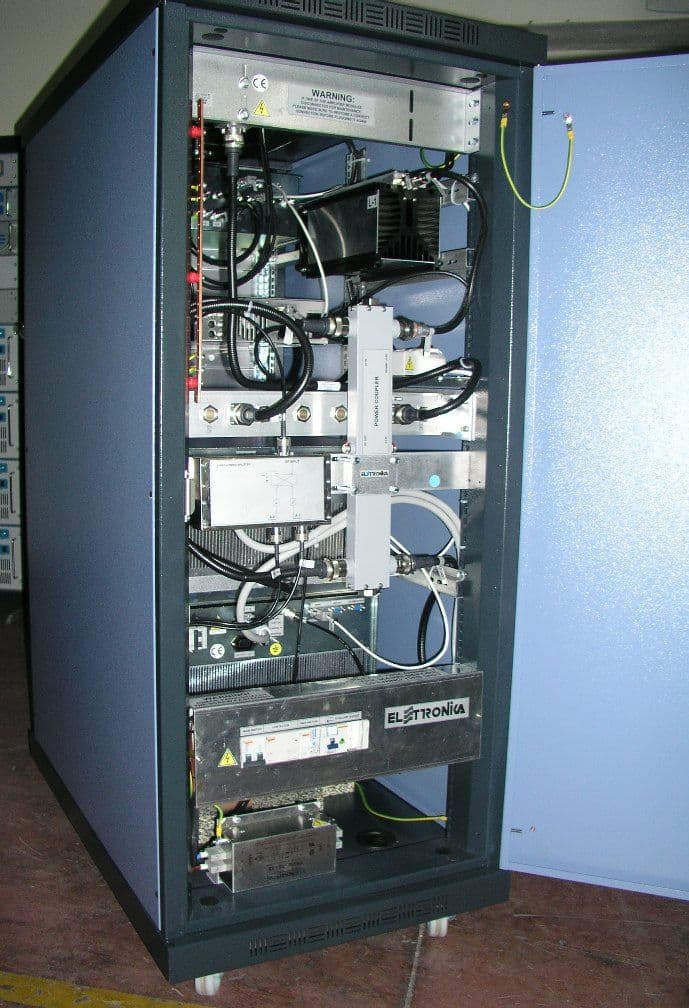
VEGA INTERNAL CONSTRUCTION PHOTOS TOP WITHOUT COVER #1 TOP WITHOUT COVER #2 BOTTOM WITHOUT COVER
Operational Description
February 2, 2005 The Operational Description for the VEGA is contained in the technical manual. Respectfully, Greg Best President Greg Best Consulting, Inc. 9223 N. Manning Ave. Kansas City, MO 64157 816-792-2913
Parts List/Tune Up Info
February 2, 2005 The parts list and tune-up info for the VEGA are contained in the technical manual. Respectfully, Greg Best President Greg Best Consulting, Inc. 9223 N. Manning Ave. Kansas City, MO 64157 816-792-2913
Schematics
February 2, 2005 The schematics for the VEGA are contained in the technical manual. Respectfully, Greg Best President Greg Best Consulting, Inc. 9223 N. Manning Ave. Kansas City, MO 64157 816-792-2913
Test Report
TEST REPORT ELETTRONIKA S. r. l. VEGA TV TRANSMITTER TECHNICAL REPORT INTRODUCTION The following information is provided to support the technical performance of the ELETTRONIKA S. r. l. VEGA TV Transmitter. The information is supplied for broadcast TV service according to applicable portions of FCC rules contained in Part 2, Part 73, and 74. 1. Power Output Measurements as indicated by FCC Rule Part 2.1046. 2. Frequency Measurements as identified by FCC Rule Part 2.1055. 3. Visual Frequency response measurements of the transmitter to be within the window specified by FCC Rule Part 74.750. 4. Occupied BW of aural signal specified by FCC Rule Part 2.1079. 5. Aural frequency response as identified by FCC Rule Part 73.687 6. Measurement of conducted harmonics and spurs +/- 3 MHz outside of channel as specified by FCC Rule Part 74.750 and Part 2 Rule 2.1051. 7. Measurement of cabinet radiation of spurs and harmonics as specified in FCC Rule 2.1053 and 2.1057. 8. Measurements of voltage and current to final amp stage as outlined in FCC Rule 2.1033. Measurements were conducted at transmitter visual power output levels of 15 watts peak of sync and 3.6 watts peak of sync and constitute the range of power for which type certification is sought. The corresponding aural power levels are 1.5 watts and 0.36 watts. Measurements were taken on a unit with visual carrier frequency of 597.25 MHz and an aural carrier frequency of 601.75 MHz. All test equipment was calibrated prior to the use of the equipment by the supplier of the test equipment. RF POWER OUTPUT The equipment was configured as below shown in Figure 1. The loss through the RF output cable, and attenuator was calibrated at the frequency of 597.25 MHz. In this case, the Bird 4391 wattmeter was inserted before the attenuator to permit power measurements to be made. The video generator was configured to produce a signal with 0 IRE video and sync. The audio generator and aural carrier were not energized. The visual portion of the transmitter was energized and the power was increased to the desired output power. The power was read on the Bird wattmeter. The TV demodulator and VM-700 were used to verify that sync compression was not causing distortion of the measurement. The aural carrier was energized and its output level was then raised to meet the precise 10 dB Visual/aural power ratio as observed on the spectrum analyzer. POWER OUTPUT Bird Power Meter reading Bird Power Meter reading at high power= 8.9 watts at low power= 2.1 watts Peak of sync power = 1.68 times Peak of sync power = 1.68 times average power reading with a black average power reading with a black picture and “0” setup picture and “0” setup Peak of sync power = 8.9 x 1.68 Peak of sync power = 2.1 x 1.68 = 15 watts = 3.5 watts TEST EQUIPMENT CONFIGURATION TWO FIELDS SHOWING CORRECT MODULATION DEPTH FOR REFERENCE WHITE & SYNC LEVELS AT 15 WATTS AND AT 3.7 WATTS Power Output = 15 watts Power Output = 3.7 watts
Test Report
FREQUENCY STABILITY MEASUREMENTS Frequency stability versus temperature and line voltage was measured in a controlled environment. For these tests the exciter RF output was fed to a frequency counter that has better than a 1ppm accuracy. The test equipment configuration is shown below. Frequency Stability versus line voltage variation Frequency Stability versus temperature The Variac was adjusted for nominal voltage and the frequency was recorded. Then the variac was adjusted to 85% and 115% of the nominal voltage and the frequency was recorded at each voltage level. The results are tabulated below. LINE VOLTAGE (Volts) Visual Frequency (MHz) Aural Frequency (MHz) 93.5 (85%) 597.249983 601.749983 110 (nominal) 597.250046 601.750046 126.5 (115%) 597.249978 601.749978 For the temperature stability measurements the exciter was placed inside a temperature chamber equipped with temperature controller. The exciter frequency was measured on the frequency counter. Measurements were first recorded at room temperature. The temperature in the chamber was changed to each of the points identified in the table below. The chamber followed a prescribed rate of change to reach each temperature and was then allowed to stabilize at the desired temperature at which time frequency measurements were made. Temperature °C Visual Frequency (MHz) Aural Frequency (MHz) 50 597.249976 601.749976 45 597.250003 601.750003 35 597.250031 601.750031 25 597.250046 601.750046 15 597.250047 601.750047 +5 597.250048 601.750048 -5 597.250051 601.750051 -15 597.250057 601.750057 -25 597.250060 601.750060 -30 597.250066 601.750066 The recorded data indicates that the total shift in frequency was 90 Hz and thus frequency stability requirements of FCC Rule 2.1055 were met. Exciter Frequency Counter Variac AC Input AC OutputRF Output Exciter Frequency Counter Temperature Chamber RF Output
Test Report
VISUAL TRANSMITTER FREQUENCY RESPONSE MEASUREMENTS The test equipment configuration of Figure 1 was used with the video generator supplying the video input waveform. For this test, the aural carrier was left energized. A variable frequency sine wave of input video waveform was used. The modulation output was increased until the maximum excursion reached reference white and 10 IRE. The RF sideband output level was measured for the sidebands below and above the visual carrier. The frequency response was plotted. Spectrum plots for both 15.0 Watt and 3.6 Watt power output conditions are displayed to confirm that the radiated envelope meets the requirements as outline in Part 74 Rule 750. POWER OUTPUT =15 WATTS POWER OUTPUT =3.7 WATTS
Test Report
OCCUPIED BANDWIDTH MEASUREMENTS The test equipment was configured as in Figure 1. The aural carrier was energized and increased in power until the desired Visual to Aural power ratio of 10 dB was met. The aural input signal was a 15 kHz sine wave taken from the audio generator. The aural deviation was increased until the desired level (85% of 25 kHz = 21.25 kHz) was indicated on the modulation analyzer. The output spectrum was observed on the spectrum analyzer noting the requirements as identified in FCC Rule Part 2.1079. As can be observed, the output spectrum meets these requirements. OCCUPIED BANDWIDTH—POWER OUTPUT = 15 watts (Scan width = 200 kHz) OCCUPIED BANDWIDTH—POWER OUTPUT = 3.7 Watts (Scan width = 200 kHz)
Test Report
AURAL FREQUENCY RESPONSE The equipment configuration of Figure 1 was used. The visual and aural carriers were energized and the aural carrier was modulated by an audio frequency generator. A reference level was set at 200 Hz and the audio generator level was adjusted to achieve 25 kHz deviation at each modulating frequency. The following table of audio response was obtained by dividing the output audio level by the input level. This table is plotted on the graph shown below. Frequency Response (dB) 100Hz -0.1 200Hz 0.0 500Hz 0.2 1kHz 0.9 2kHz 2.9 5kHz 8.3 10kHz 13.6 13kHz 15.6 15kHz 16.6 AURAL FREQUENCY RESPONSE GRAPH WITH LIMITS The red line is the plotted results.
Test Report
CONDUCTED SPURIOUS AND HARMONICS The following photographs indicate the spurious performance (> +/- 3 MHz) from the designated TV channel. As can be seen from the photos (one taken at 15 Watts and the other taken at 3.7 Watts), the spurious levels are below 60 dB relative to the peak of sync of the visual carrier. The top center of the screen indicates the true peak of sync value when the vertical interval portion of the picture is present. These photos indicate the desired 10 dB visual to aural power ratio as the scale per division is 10 dB. POWER OUTPUT = 15 Watts POWER OUTPUT = 3.7 Watts CONDUCTED HARMONIC OUTPUTS The following data indicates the harmonic performance of the VEGA. No harmonics were visible. Photographs of the spectrum evaluating all harmonics are shown below. The pictures indicate that the harmonic levels are well below 60 dB compared to the top of the screen which represents visual sync peak power. POWER OUTPUT = 15 Watts POWER OUTPUT = 3.7 Watts Both photographs indicate the fundamental frequency at 600 MHz. The fundamental frequency visual peak of sync reference value is located at the top of the screen on these photographs. The values indicate that the required performance of -60 dB is met.
Test Report
CABINET RADIATION The transmitter and test equipment were configured as shown below including the angles of measurement with respect to the transmitter cabinet. The photo on the subsequent page also shows one view of the physical set-up of the test equipment and equipment under test. The transmitter was operated at 15 watts peak sync power with a 10 dB visual/aural ratio with the video input signal being a Modulated Stairstep signal. The free space path loss and antenna gain characteristics were obtained at the fundamental frequency and at each of the harmonics of the visual carrier frequency in order to accurately assess the level of the signal radiated from the cabinet. Radiation from the cabinet was measured with 4 different physical rotation angles: 0, 90, 180, and 270 degrees (0 degrees being the front of the cabinet). All spectral components above -80 dB referenced to peak sync power radiated from the cabinet were recorded. The values are tabulated in the table on the next page following the photos. TEST EQUIPMENT CONFIGURATION Spectrum Analyzer VEGA XMTR Dummy Load Receiving Antenna VEGA 0° Front 90° 180° 270° PHYSICAL CABINET RADIATION TEST CONFIGURATION This photograph shows the actual laboratory environment in which the cabinet radiation tests were conducted. The antenna and Unit Under Test is shown in the photograph. The transmitter was rotated 90 degrees for each of the measurement orientations. As indicated in the spreadsheet data on the following page, the worst case measurement was 62 dB at the second harmonic. (This photo on the next page shows this particular measurement). The measurement tables for the all views of the transmitter at each frequency are shown below. The results indicate that all radiated harmonics meet the FCC requirement of 60 dB as outlined in FCC rule 2.1053 and 2.1057. CABINET RADIATION DATA Cabinet Radiation for VEGA Frequency Measured FS FS (Voltage) Equivalent Radiated Power Power Relative to P out of 15 watts MHZ dBuV/m V/m watts dBm dB 597.25 80 0.01 72.7E-6 -11.4 -53 ALL others <25 0.000112 2.35E-10 -66 -108 Note: 25 dBμV was the noise floor of the spectrum analyzer used for the measurements. VOLTAGES AND CURRENTS TO FINAL AMPLIFIERS Final amplifier DC voltage and current measurements were made with the transmitter operating at 15 Watts power output and at 3.7 watts power output. A video input signal of sync and 0 IRE “setup” level was used. The aural carrier was energized and adjusted for the proper 10 dB Visual to Aural power ratio. Voltage and current measurements were made at the transmitter. Peak Output Power = 15 Watts Voltage = 26.5 volts Total DC Current = 4.6 amps Final amplifier DC power input = 26.5 x 4.6 = 122 watts Peak Output Power = 3.7 Watts Voltage = 26.5 volts Total DC Current = 4.5 amps Final amplifier DC power input = 26.5 x 4.5 = 119 watts EQUIPMENT LIST The following test equipment was used in the various test equipment configurations or to create calibration of equipment at various frequencies. All equipment was known to be in good working order and the equipment was within the calibration period. Type Manufacturer Model Date of Calibration Calibration Expired Spectrum Analyzer Advantest R3132 11/11/03 11/11/04 Signal Generator Platform Tektronix TG2000 15/05/04 15/05/05 Video Measurement Set Tektronix VM700A 09/01/04 09/01/05 TV Test Receiver Rohde&Schwarz EFA 15/05/04 15/05/05 Selective Modulation Analyzer Rohde&Schwarz FMAS 02/04/04 02/04/05 Wattmeter BIRD 4391 02/04/04 02/04/05 Thermal detector CAREL IR32c 15/05/01 15/05/05 Humidity detector CAREL S90HP 15/05/01 15/05/05 Thermal Chamber COTER N/A Attenuator Elettronika N/A Dummy Load 100W Elettronika N/A
Contact Information
Applicant
Francesco Paparella(Design Omologation and Compliance Mgr)
Technical Contact
Greg Best Consulting, IncGreg Best
[email protected]816-792-2913
9223 N. Manning Avenue · Kansas City, Missouri · United States
Technical Specifications
| # | Rule Parts | Frequency Range | Power Output | Emission | Tolerance |
|---|---|---|---|---|---|
| 2 | 74 | 470 MHz - 806 MHz | 1.5 W | 250KF3E | 1000 Hz |
Other Applications from Elettronika S.r.l.
PHLTXUD1000A
Jul 07, 20101000 W ATSC Transmitter
Equipment Class
TBC - Licensed Broadcast Station Transmitter
PHLTXUD3000A
Jun 17, 20103000 Watt ATSC Transmitter
Equipment Class
TBC - Licensed Broadcast Station Transmitter
PHLTXUD2000A
Jun 09, 20102000 Watt ATSC Transmitter
Equipment Class
TBC - Licensed Broadcast Station Transmitter
PHLMIZAR30
Jul 01, 200830 Watt FM Broadcast Transmitter
Equipment Class
TBC - Licensed Broadcast Station Transmitter
PHLMIZAR300
Jul 01, 2008300 Watt FM Broadcast Transmitter
Equipment Class
TBC - Licensed Broadcast Station Transmitter