PW2UTX2-5KULTRAAnalog 2.5 kW TV Transmitter
Pineapple Technology, Inc.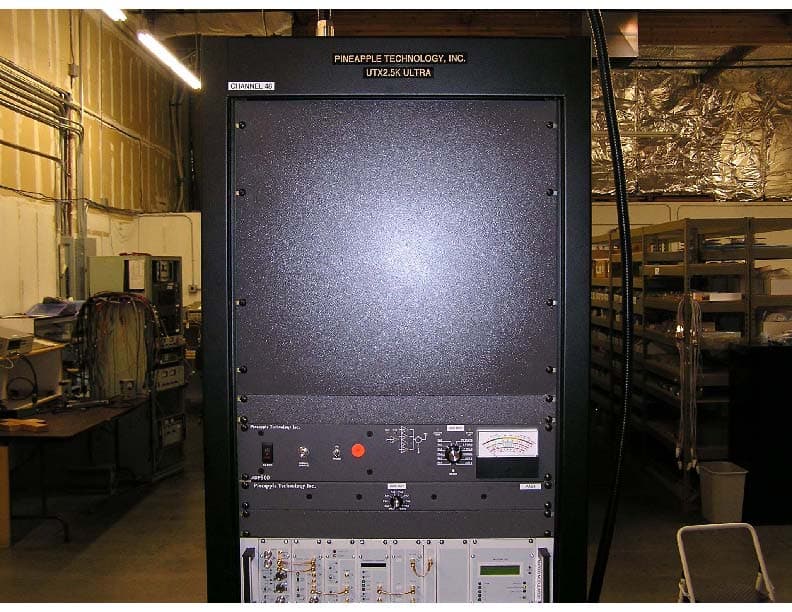
Click to zoom
Application Details
- Equipment Class
- TBC - Licensed Broadcast Station Transmitter
- Date of Grant
- Jan 29, 2007
- Application Purpose
- Original Equipment
- Date of Application
- Nov 02, 2006
- Equipment Note
- Analog 2.5 kW TV Transmitter
- Frequency Range
- 614.00000000 - 806.00000000
- Company
- Pineapple Technology, Inc.
- Country
- United States
Documents & Files
Document Text
Text extracted from the exhibit documents filed with the FCC. Open a document above to read the original.
Users Manual
UTX2.5K ULTRA INSTRUCTION MANUAL PINEAPPLE TECHNOLOGY, INC PINEAPPLE TECHNOLOGY, INC. UTX2.5K ULTRA Operating and Service Manual TABLE OF CONTENTS Section l --- SAFETY NOTICES .................................................................................... 2 ** READ THIS SECTION BEFORE INSTALLATON * * Secton ll --- TRANSMITTER SPECIFICATIONS ............................................................... 3 Section lll --- TRANSMITTER INSTALLATION ............................................................ ... 5 Section lV --- TRANSMITTER TURN-ON ........................................................................ 6 Section V --- THEORY OF OPERATION A. Introduction ..........................................................................................7 B. ACDIS2 AC Main Distribution ..................................................................7 C. AC2008 Power Supply ...........................................................................7 D. PAS3 and ADP500 Performance Monitor ................................................ ...8 E. RC8 Remote Monitor and Control W/ABS ................................................ ...9 F. MA5000 Modulator .............................................................................. ...10 G. UDR100AC Driver .............................................................................. ...10 H. S3 3-Way Splitter ................................................................................. ...10 I. MFA2PA Dual Power Amplifier ............................................................... ...10 J. UC3KW 3-Way Combiner ..................................................................... ...11 K. DC3KW Directional Coupler ..................................................................... ...11 L. BPU3K Bandpass Filter ........................................................................ ...11 SECTION Vl --- SCHEMATIC AND PARTS LISTS A. UTX2.5K ULTRA ......................................................................................12 B. ACDIS2 AC Main Distribution .................................................................. 14 C. UDR100AC Driver .............................................................................. ...16 D. MFA2PA Dual Power Amplifier ............................................................... ...18 1. 1A0035 Status Board ............................................................... ...20 2. PA1K 1KW Power Module ......................................................... ...21 a. U500LDA 500 W Amplifier ............................................. ...21 b. U250LD 250 W Amplifier ............................................. ...21 c. 1A0025 Power Distribution Monitor ...........................21 d. 1A0018 Gain and Phase Matching Network ...............21 E. UC200-3 3-Way Splitter ........................................................................ ...24 F. UC2KW3NDC 3-Way Combiner with Directional Coupler................................. 26 G. BPU3KW Bandpass Filter ..................................................................... ...27 H. PAS10 and ADP500 Performance Monitor ................................................ 28 SECTION Vll --- RECOMMENDED ROUTINE MAINTENANCE ....................................... ... 30 SECTION Vlll --- ADJUSTMENTS AND TUNING ............................................................ 32 SECTION lX --- PROBLEM SOLVING / TROUBLESHOOTING ....................................... ... 34 SECTION X --- WARRANTY ....................................................................................... 37 SECTION Xl --- EXTENDED WARRANT Y ..................................................................... n Section I Safety Notices PINEAPPLE TECHNOLOGY, INC. UTX2.5K ULTRA Operating and Service Manual l --- SAFETY NOTICES l ---SAFETY NOTICES ** READ THIS SECTION BEFORE INSTALLATION ** SEVERE ELECTRICAL SHOCK OR BURNS MAY OCCUR IF THIS EQUIPMENT IS USED IMPROPERLY. NEVER WORK ON THIS EQUIPMENT ALONE. ALWAYS HAVE ANOTHER PERSON PRESENT WHILE WORKING ON ELECTRICAL CIRCUITS OR MOVING EQUIPMENT. COMMUNICATIONS TO EMERGENCY SERVICES SHOULD BE AVAILABLE AT ALL TIMES. BEFORE CONNECTING THIS EQUIPMENT TO ANY AC ELECTRICAL SOURCE READ THE SECTION ON INSTALLATION. ALL ELECTRICAL WIRING FOR THIS EQUIPMENT MUST BE PERFORMED BY QUALIFIED ELECTRICIANS. ALL WIRING MUST BE COMPLIANT WITH LOCAL ELECTRICAL CODES. POWER AMPLIFIERS AND SUPPLIES ARE HEAVY. TO INSTALL THIS EQUIPMENT IN RACKS USE TWO (2) PERSONS TO AVOID POSSIBLE INJURIES. NEVER OPEN THE CABINET ENCLOSURE OR UNPLUG CABLES OR WIRES WHILE THIS EQUIPMENT IS OPERATING. ALL SERVICE WORK MUST BE PERFORMED BY QUALIFIED TECHNICIANS ONLY . IF ONE IS NOT AVAILABLE LOCALLY, CONTACT PINEAPPLE TECHNOLOGY, INC. FOR A LIST IN YOUR AREA. Page 2 Section II Transmitter Specifications THESE SPECIFICATIONS ARE SUBJECT TO CHANGE WITHOUT NOTICE. PINEAPPLE TECHNOLOGY, INC. UTX2.5K ULTRA Operating and Service Manual II – TRANSMITTER SPECIFICATIONS II – UTX2.5K ULTRA SPECIFICATIONS OPERATING Power Output .............................. 2.5 kW Peak Sync 125 Watts Aural RF Output Impedance..................... 50 ohms Frequency Range........................... 470 – 806 MHz Frequency Stability........................ 1 PPM or better Harmonic and Spurious..................... -60 dB or better ref to P-sync Power Consumption........................ 14 kW maximum AC Line Voltage........................... 208 – 240 VAC Single Phase VIDEO PERFORMANCE Visual Frequency Response............... +/- 1 dB across the TV channel -1.25 MHz to 4.75 Mhz relative to visual carrier. Differential Gain................................. .< 7% Differential Phase................................. < 10 degrees ICPM...............................................< 5 degrees Low Frequency Linearity....................... < 15% Group Delay...................................... Meets FCC Part 73 Rule Video Input Impedance......................... 75 ohms Video Input L…
Text truncated - open the document above for the full version.
Block Diagram
SIZE FSCM NO. SCALE SHEET DWG NO . REV Pineapple Technology , Inc. Rocklin, CA UTX2.5K UL TRA BLOCK DIAGRAM 1of1 FIT B 4 SECTION VI – SCHEMATICS AND PARTS SUB-SECTION A - UTX2.5K ULTRA Modulator MA5000 PAS3 Bandpass 3-Way Combiner UC2KW3NDC 3-Way Combiner Directional Coupler with BPU3KW Filter 3-Way Splitter US200-3 UDR100AC 100 W Driver ADP500 Po Level Po Level Xmtr On/Of f Xmtr On/Of f Aural RC8 Remote Control (Optional) Phone Line +12 VDC Visual IF RF Output AC Inlet AC Inlet AC Inlet Fwrd Pwr Rfld Pwr A A B CAL CAL ATT ATT R F DC Distribution P anel DC Amps DC Volts Main AC 220 V AC Main Distribution ACDIS2 220 VAC 220 VAC 110 VAC 220 VAC A AC Inlet AC Out AC Inlet DC Output +32 VDC A D MFA2PA PA2 M +DC RF IN PA3 M +DC RF IN MFA2PA PA1 M +DC RF IN MFA2PA PA1 Rack Fan D D D MFA2PA PA2 PA3 PA Fans +32 VDC 125A 125A 125A AC2009 4KW Power Supply 100 mv FS Meter Shunt 220VAC FAN A FAN B 220VAC 110VAC 220VAC 10 AUX Directional Coupler
Cover Letter(s)
January 25, 2007 Federal Communications Commission Office of Engineering Technology 445 12 th Street SW Washington, DC 20554 Dear Sir, This letter will serve to address FCC correspondence letter 32229 and also 32466 regarding the type certification for the PTI UTX2.5K Ultra broadcast transmitter. The associated FCC ID number is PW2UTX2-5KULTRA. Specifically, the correspondence letters identified above seek additional information on how the transmitter is configured regarding whether integral components are the same for both frequency ranges of the proposed grant frequencies. As the technical consultant for Pineapple Technology Inc., they have authorized me to provide the information which should help resolve this question. It is my technical opinion that only one set of test data needs to be submitted for both frequency ranges 470-608 MHz and 614-806 MHz based upon the design of the unit. The design of the unit is such that the amplifier works over the entire 470-806 MHz with no change of parts. The only frequency dependent parts within the transmitter are circulators attached to the output of the individual amplifiers, the channel filter in the exciter, and transmitter final bandpass filter. The circulators are passive devices and consist of the same block of ferrite with different tuning capacitors to optimize the frequency response in three frequency ranges in the 470-806 band. Each has the exact same set of specifications. These circulators are purchased by PTI from manufacturers who have already optimized the response before shipment to PTI. The exciter filter is a passive device and consists of one item that is tuned per operating channel. The filter is ordered and delivered to PTI based upon the operating channel. Likewise the transmitter final bandpass filter is the same block of material but it is tuned to the desired operating channel and supplied by the manufacturer to PTI. The performance obtained at any test frequency within the entire range of 470-806 MHz will be representative of each transmitter shipped. If there are any clarifications needed or you have any questions please give me a call at the number above. Sincerely, Greg Best President Cc Robert Artigo, Pineapple Technology Inc. Greg Best Consulting, Inc. 9223 N. Manning Ave. Kansas City, MO 64157 816-792-2913
External Photos
EXTERNAL CONSTRUCTION PHOTOS OF THE UTX3K ULTRA TV TRANSMITTER FRONT VIEW FRONT VIEW—TOP THIRD FRONT VIEW—MIDDLE THIRD FRONT VIEW—BOTTOM THIRD
External Photos
EXTERNAL CONSTRUCTION PHOTOS OF THE UTX2.5K ULTRA TV TRANSMITTER (Continued) LEFT SIDE VIEW RIGHT SIDE VIEW REAR VIEW
ID Label/Location Info
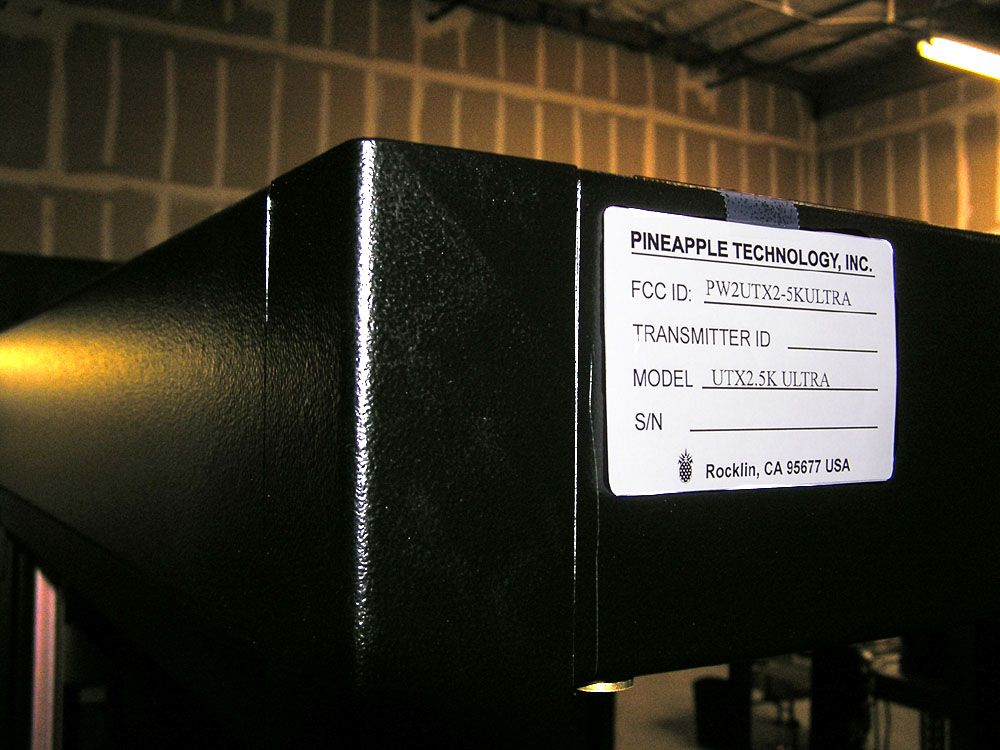
PINEAPPLE TECHNOLOGY, INC.PINEAPPLETECHNOLOGY,INC. FCC ID: TRANSMITTER ID MODEL S/N Rocklin, CA 95677 USA PW2UTX2.5KULTRA UTX2.5K ULTRA
ID Label/Location Info
PINEAPPLE TECHNOLOGY, INC.PINEAPPLETECHNOLOGY,INC. FCC ID: TRANSMITTER ID MODEL S/N Rocklin, CA 95677 USA PW2UTX2-5KULTRA UTX2.5K ULTRA
Internal Photos
INTERNAL CONSTRUCTION PHOTOS OF THE UTX2.5K ULTRA TV TRANSMITTER INTERNAL CONSTRUCTION—REAR DOOR OPEN REAR VIEW—TOP THIRD REAR VIEW—MIDDLE THIRD REAR VIEW—BOTTOM THIRD
Operational Description
OPERATIONAL DESCRIPTION OF THE UTX2.5K ULTRA
Parts List/Tune Up Info
PARTS LISTS AND ASSEMBLY INFORMATION FOR THE UTX2.5K ULTRA
Schematics
SCHEMATICS FOR THE UTX2.5K ULTRA TV TRANSMITTER
Test Report
TEST REPORT PINEAPPLE TECHNOLOGY INC. UTX2.5K ULTRA TV TRANSMITTER TECHNICAL REPORT INTRODUCTION The following information is provided to support the technical performance of the Pineapple Technology UTX2.5K ULTRA TV Transmitter. The information is supplied for broadcast TV service according to applicable portions of FCC rules contained in Part 2, Part 73, and 74. 1. Power Output Measurements as indicated by FCC Rule Part 2.1046. 2. Frequency Measurements as identified by FCC Rule Part 2.1055. 3. Visual Frequency response measurements of the transmitter to be within the window specified by FCC Rule Part 74.750. 4. Occupied BW of aural signal specified by FCC Rule Part 2.1079. 5. Aural frequency response as identified by FCC Rule Part 73.687 6. Measurement of conducted harmonics and spurs +/- 3 MHz outside of channel as specified by FCC Rule Part 74.750 and Part 2 Rule 2.1051. 7. Measurement of cabinet radiation of spurs and harmonics as specified in FCC Rule 2.1053 and 2.1057. 8. Measurements of voltage and current to final amp stage as outlined in FCC Rule 2.1033. Measurements were conducted at the transmitter visual power output level of 2,500 watts peak of sync (W ps ) for which type certification is sought. The corresponding aural power level is 125 watts. Measurements were taken on a unit with visual carrier frequency of 675.25 MHz and an aural carrier frequency of 679.75 MHz. The test equipment used for the measurements on the next few pages is listed at the end of the test report. All test equipment was calibrated prior to the use of the equipment by the supplier of the test equipment. RF POWER OUTPUT The equipment was configured as shown in Figure 1. The loss through the directional coupler was calibrated at the operating frequency (677.0 MHz). The TSG-90 video generator was configured to produce a signal with 0 IRE video and sync. The aural carrier was not energized. The visual portion of the transmitter was energized to the desired output power (2.5 kWps). The power was read on the HP-435B Power Meter. The video demodulator and 1750 were used to verify that sync compression was not causing distortion of the measurement. The aural carrier was energized and its output level was then raised to meet the precise 13 dB visual/aural power ratio as observed on the spectrum analyzer. Pictures were also taken of demodulated video with two (2) lines of a modulated stair step (or reference white level) , and two (2) fields of video to verify no signal distortions were present at the 2.5 kW power level where certification is being sought. HIGH POWER OUTPUT HP 435B Power Meter reading 9.7 dBm Loss in directional coupler 52.0 dB Sum 61.7 dBm = 1,479 W Avg Peak of sync power = 1.68 times average power under the following conditions: 0 IRE (Black) picture No aural carrier 40 IRE of sync Proper sync to video ratio (40/100) and depth of modulation, this is shown by the two line modulated stair step display. 1,479 W Avg. X 1.68 = 2,485 W peak of sync (Within .03 dB of 2,500 W) The aural carrier was set 13 dB lower. 2,500 W ps = 64 dBm minus 13 dB equals 51 dBm = 125 W Aural Power DC voltage and current to final amplifier stage is: 170 Amps at 32 VDC measured with black level input. Fig. 1 Meter indicating 9.7 dBm for visual RF Power Output Fig. 2 Two Lines of video showing proper Modulation depth Fig.3 Two Fields of video showing proper Modulation depth
Test Report
Frequency Stability Measurements (NTSC) Tested by: Jim Collier on May 25, 2006 EQUIPMENT MODEL:Screen Service SCT 020U EXCITER Frequency stability versus temperature and line voltage was measured in a controlled environment. For these tests the exciter RF output was fed to a calibrated frequency measuring device that has better than a 1ppm accuracy. The test equipment configuration is shown below. The variac was adjusted for nominal voltage and the frequency was recorded. Then the variac was adjusted to 85% and 115% of the nominal voltage and the frequency was recorded at each voltage level. The results are tabulated below. Line Voltage (Volts) Visual Frequency (MHz)Aural Frequency (MHZ) 104 (85%)693.250033697.7500079 122 (Nominal)693.250035697.750081 140 (115%)693.250033697.750077 For the temperature stability measurements the exciter was placed inside a Tenney temperature chamber equipped with a MicroTenn II temperature controller. The exciter was energized and the frequencies were measured on the frequency counter. The temperature was then raised to +50 ºC, allowed to stabilize for 15 minutes and then cycled to each colder temperature where it was allowed to stabilize for 10 minutes before recording the measured frequency and moving on to the next lower temperature. Temperature ◦C TimeVisual Frequency (MHz)Aural Frequency (MHz) 2511:30693.250123697.750171 5012:00693.249991697.750041 4012:15693.250017697.750064 3012:30693.250085697.750125 2012:45693.250135697.750183 101:00693.250197697.750241 01:15693.250276697.750322 -101:30693.250317697.750361 -201:45693.250319697.750353 -302:00693.250437697.750474 The recorded data indicates that the frequency stability requirements of FCC Rule 2.1055 were met. VariacExciter Freq Measuring Device AC InputAC OutputRF Output Freq Measuring Device Exciter RF Output Temperature Chamber
Test Report
OCCUPIED BANDWIDTH MEASUREMENTS The test equipment was configured as in Figure 7. The aural carrier was energized and increased in power until the desired visual to aural ratio of 13dB (5%) was met. The visual waveform used was a 0 IRE video input level from the TSG-90 and the aural input signal was a 15kHz sine wave taken from the HP339A Distortion Measurement Set. The aural deviation was increased until the desired level (85% of 25kHz =21.25 kHz) was indicated by the HP339A Distortion Measurement Set monitoring the calibrated deviation output (25mV/kHz) of the MSI 320 Precision Video Demodulator. The output spectrum was observed on the HP Spectrum Analyzer noting the requirements as identified in FCC Rule Part 2.1079. As can be observed, the output waveform meets these requirements. OCCUPIED BANDWIDTH- POWER OUTPUT =2.5 kW ps (Scan width = 200kHz) Fig. 7
Test Report
AURAL FREQUENCY RESPONSE The equipment configuration of Figure 1 was used. The visual and aural carriers were energized and the aural carrier was modulated by the HP 339A Distortion Measurement Set. The visual input waveform used was a “0” IRE video input level from the TSG-90. A reference level was set at 100Hz and the audio generator level was adjusted to achieve 25kHz deviation at each modulating frequency using the calibrated audio output (25mV/kHz into 75 ohms) from the MSI 320 TV demodulator. An oscilloscope was used to compare the input voltage with the output demodulated voltage from the MSI 320 TV demodulator to determine the response level. The following table of audio response was obtained by dividing the output audio level by the input level. This table is plotted on the graph shown below. The input termination to the UTX2.5K ULTRA was fixed at 600 ohms. FREQUENCY RESPONSE DATA TABLE Frequency (Hz) Level (dB) 50 -0.3 100 (Reference) 0.0 200 0.0 400 0.1 800 0.5 1k 0.8 2k 2.4 4k 6.2 8k 11.2 10k 12.6 15k 15.6 Chart 1 Tested by: Ed Wood Date:8/24/06
Test Report
1 Tested By: Ed Wood Date: 8/24/06 VISUAL TRANSMITTER FREQUENCY RESPONSE MEASUREMENTS The test equipment configuration of Figure 1 was used with the 1410 video generator supplying the video input waveform. For this test, the aural carrier was left energized. A variable frequency sine wave sweep of 90 IRE Peak-to-Peak amplitude from 100 kHz to 6.0 MHz with pedestal set at 52.5 IRE input video waveform was used. The modulation output was increased until the maximum excursion reached reference white and 10 IRE as shown in the photos in Fig. 4 and Fig. 5 below. The RF sideband output level was measured for the sidebands below and above the visual carrier. The frequency response was displayed on the HP Spectrum Analyzer. The spectrum plot, showing markers at the Visual Carrier and at 4.75 MHz ( 51 dB down from Visual Carrier ), is displayed in Fig. 6 to confirm that the radiated envelope meets the requirements as outlined in FCC Part 74 Rule 750. FREQUENCY RESPONSE INPUT WAVEFORMS Fig. 4 - Two (2) Horizontal Lines 2 Fig. 5 – Two (2) Fields The photograph of the spectrum analyzer display below demonstrates compliance with FCC 74.750. Fig. 6
Test Report
1 Tested By Ed Wood Date: 8/23/06 CONDUCTED SPURIOUS AND HARMONICS The following photographs indicate the spurious performance (> +/- 3 MHz) from the designated TV channel. As can be seen from the photo taken at 2,500 W, the spurious levels are below 60 dB relative to the peak of sync of the visual carrier. The diamond in the top center of the screen indicates the true peak of sync value when the vertical interval portion of the picture is present. The photo in Fig. 8 shows the desired 13 dB visual to aural power ratio. Fig. 8 CONDUCTED HARMONIC OUTPUTS The following data indicates the harmonic performance of the UTX2.5K ULTRA. Only the 2 nd harmonic was visible. The following table displays the actual value of the harmonic that takes into account the coupling factor of the directional coupler and loss of the cable used for the measurement. There was no value recorded when the instrument measured value was <-72dB relative to the visual peak of sync value as this was below the noise floor of the spectrum analyzer with the bandwidth used. Photographs of the spectrum containing the second harmonic are shown below. The pictures 2 indicate that the harmonic levels are well below 60 dB compared to the diamond at the top of the screen which represents visual sync peak power. HARMONIC LEVELS VERSUS FREQUENCY AT 2,500 W FREQUENCY OF HARMONIC (MHz) AMPLITUDE (Relative to visual Peak Sync at fundamental frequency (dB)) 1350.5 (2 nd harmonic) -66 dB 2025.75 (3 rd harmonic) ** dB 2701.0 (4 th harmonic) ** dB 3376.25 (5 th harmonic) ** dB 4051.5 (6 th harmonic) ** dB 4726.75 (7 th harmonic) ** dB 5402.00 (8 th harmonic) ** dB 6077.25 (9 th harmonic) ** dB 6752.5 * (10 th harmonic) ** dB * Note: Spectrum Analyzer not rated for this frequency ** Note: Amplitude at or below the noise floor of -75dBc Photo of 2 nd Harmonic Spectrum Fig. 9 The photograph in Fig. 9 is centered at the 2 nd Harmonic because only that harmonic was possibly visible. The fundamental frequency visual peak of sync reference value is located at the top of the screen on this photograph. The values indicate a maximum harmonic level of -66 dB when corrected for coupling and cable loss. 3 Fig. 10 The photograph in Fig. 10 is centered at the 3 rd Harmonic showing the noise floor at around -75 dB when corrected for coupling and cable loss. The fundamental frequency visual peak of sync reference value is located at the top of the screen on this photograph.
Test Report
CABINET RADIATION The transmitter and test equipment were configured as shown below including the angles of measurement with respect to the transmitter cabinet. The photo on the subsequent page also shows the physical set-up of the test equipment and equipment under test. The transmitter was operating at 2.5kW peak sync power with a 13dB visual/aural ration with the video input signal being a sync signal and .50 IRE “set-up” level. The free space path loss, cable loss and antenna gain characteristics were obtained at the fundamental frequency and at each of the harmonics of the visual carrier frequency in order to accurately assess the level of the signal radiated from the cabinet. Radiation from the cabinet was measured at a distance of 30 feet in 4 different physical rotation angles: 0, 90, 180 and 270 degrees ( 0 degrees being the front of the cabinet). All spectral components above -80 dB referenced to peak sync power radiated from the cabinet were recorded. The values are tabulated in the table on the next page following the photo. PHYSICAL CABINET RADIATION TEST CONFIGURATION This photograph shows the actual laboratory environment in which the cabinet radiation tests were conducted. The log periodic antenna, cable and spectrum analyzer are shown in the foreground and the UTX2.5K ULTRA is shown in the background. The transmitter was rotated 90 degrees for each of the measurement orientations. As calculated from the spreadsheet data on the following page, the worst case measurement was 65.1 dB at the second harmonic (The photo above shows this particular measurement). The measurement tables for the remaining views of the transmitter are shown on the following pages. Pineapple Technology Inc. CABINET RADIATION TEST TEST INPUTSCONDITIONS & PARAMETERS TEST DATE:> 9/13/2006 TEST ENGINEER:> Jim Collier TRASMITTER MODEL NO:> UTX2.5K ULTRA OPERATING POWER OUTPUT LEVEL> 64.0dBm2500Power in Watts OPERATING FREQUENCY IN GHz> 0.675gHz48Channel ANTENNA MODEL NUMBE R> ETS 3147 S/N 9112-1053 SPECTRUM ANALYZER MODEL> 8595E DISTANTS TO TRASMITTER IN METERS> 10METERS FRONTVIEW Harmonic Frequency SIGNALCABLE ANTENNAPATH ADJMAXIMUMSTATUS LEVELLOSS dB GAIN dB LOSS dBLEVELLEVELP=PASS GHzdBmdBdBdBdBmdBm Fc0.675-21.90.46.649.0921.015334.0N/A Fc*21.35-500.87.055.11-1.119824.0P Fc*32.025-621.14.358.63-6.553754.0P Fc*42.7-721.53.061.13-12.41074.0P Fc*53.375-881.84.463.07-27.52834.0P Fc*64.05-882.21.164.65-22.30044.0P Fc*74.725-882.5-1.365.99-18.21724.0P Fc*85.4-882.81.967.15-19.91314.0P Fc*96.075-883.22.168.17-18.74584.0P Fc*106.75-883.52.169.09-17.48644.0P RIGHT VIEW Harmonic Frequency SIGNALCABLE ANTENNAPATH ADJMAXIMUMSTATUS LEVELLOSS dB GAIN dB LOSS dBLEVELLEVEL GHzdBmdBdBdBdBmdBm Fc0.675N/A0.46.649.09N/A4.0N/A Fc*21.35-510.87.055.11-2.119824.0P Fc*32.025-641.14.358.63-8.553754.0P Fc*42.7-751.53.061.13-15.41074.0P Fc*53.375-881.84.463.07-27.52834.0P Fc*64.05-882.21.164.65-22.30044.0P Fc*74.725-882.5-1.365.99-18.21724.0P Fc*85.4-882.81.967.15-19.91314.0P Fc*96.075-883.22.168.17-18.74584.0P Fc*106.75-883.52.169.09-17.48644.0P REARVIEW Harmonic Frequency SIGNALCABLE ANTENNAPATH ADJMAXIMUMSTATUS LEVELLOSS dB GAIN dB LOSS dBLEVELLEVEL GHzdBmdBdBdBdBmdBm Fc0.675N/A0.46.649.09N/A4.0N/A Fc*21.35-620.87.055.11-13.11984.0P Fc*32.025-601.14.358.63-4.553754.0P Fc*42.7-881.53.061.13-28.41074.0P Fc*53.375-881.84.463.07-27.52834.0P Fc*64.05-882.21.164.65-22.30044.0P Fc*74.725-882.5-1.365.99-18.21724.0P Fc*85.4-882.81.967.15-19.91314.0P Fc*96.075-883.22.168.17-18.74584.0P Fc*106.75-883.52.169.09-17.48644.0P LEFTVIEW Harmonic Frequency SIGNALCABLE ANTENNAPATH ADJMAXIMUMSTATUS LEVELLOSS dB GAIN dB LOSS dBLEVELLEVEL GHzdBmdBdBdBdBmdBm Fc0.675N/A0.46.649.09N/A4.0N/A Fc*21.35-520.87.055.11-3.119824.0P Fc*32.025-581.14.358.63-2.553754.0P Fc*42.7-851.53.061.13-25.41074.0P Fc*53.375-881.84.463.07-27.52834.0P Fc*64.05-882.21.164.65-22.30044.0P Fc*74.725-882.5-1.365.99-18.21724.0P Fc*85.4-882.81.967.15-19.91314.0P Fc*96.075-883.22.168.17-18.74584.0P Fc*106.75-883.52.169.09-17.48644.0P
Contact Information
Applicant
Robert Artigo(President)
Technical Contact
Greg Best Consulting, Inc.Greg Best
[email protected]816-792-2913
9223 N. Manning Avenue · Kansas City, Missouri · United States
Technical Specifications
| # | Rule Parts | Frequency Range | Power Output | Emission | Tolerance |
|---|---|---|---|---|---|
| 2 | 73,74 | 614 MHz - 806 MHz | 125 W | 250KF3E | 1000 Hz |
Other Applications from Pineapple Technology, Inc.

PW2DTXPRO10U
Aug 31, 201110 W DTV TRANSMITTER
Equipment Class
TBC - Licensed Broadcast Station Transmitter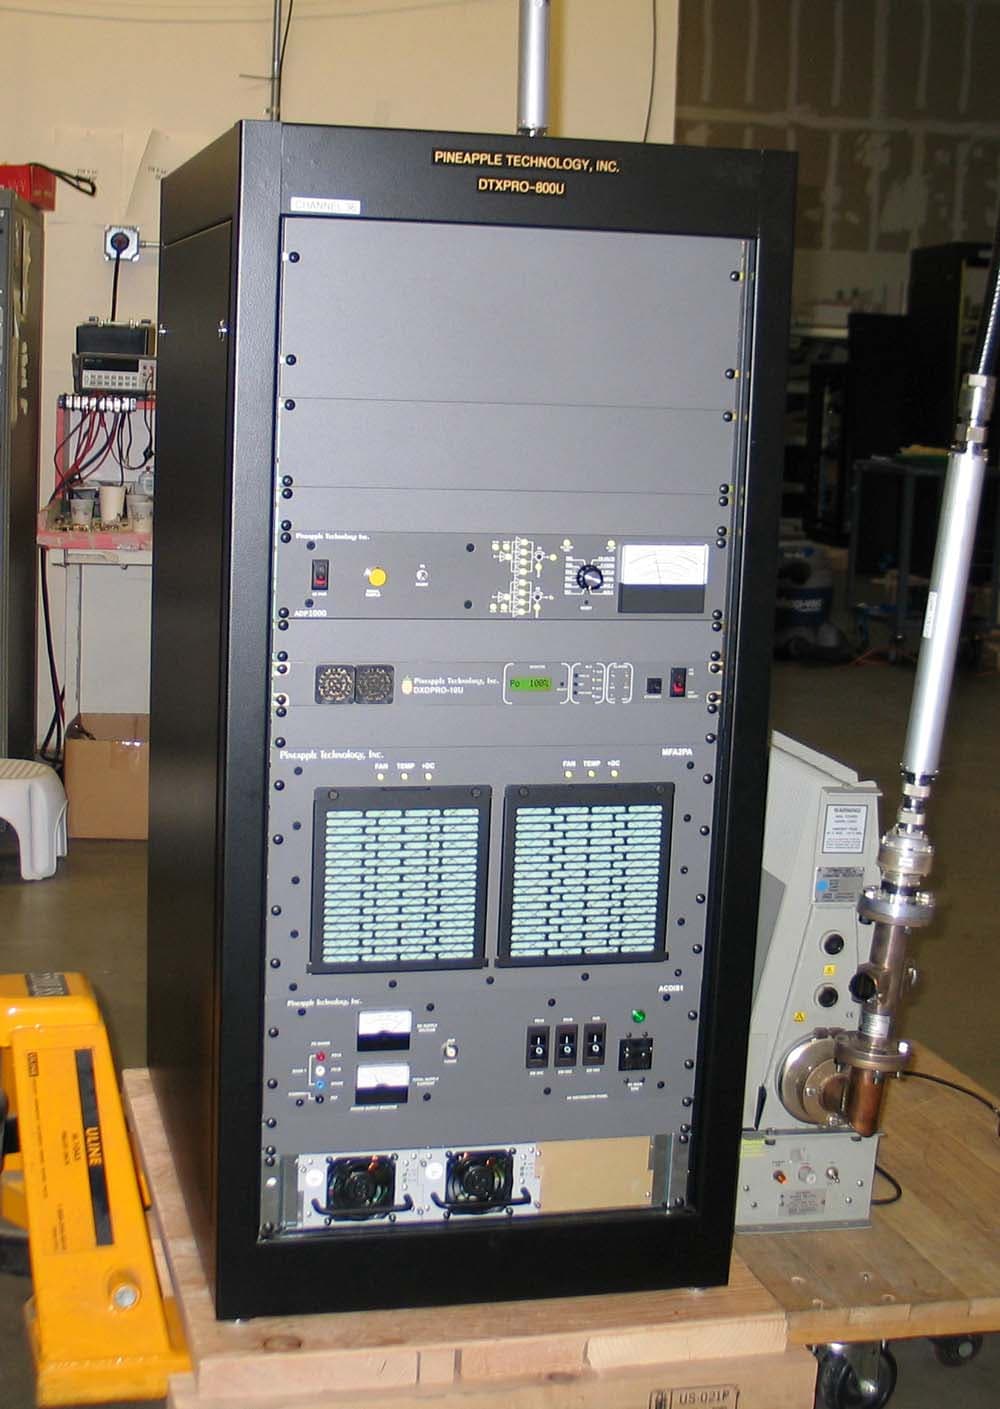
PW2DTXPRO800U
Mar 01, 2011800 W DTV TRANSMITTER
Equipment Class
TBC - Licensed Broadcast Station Transmitter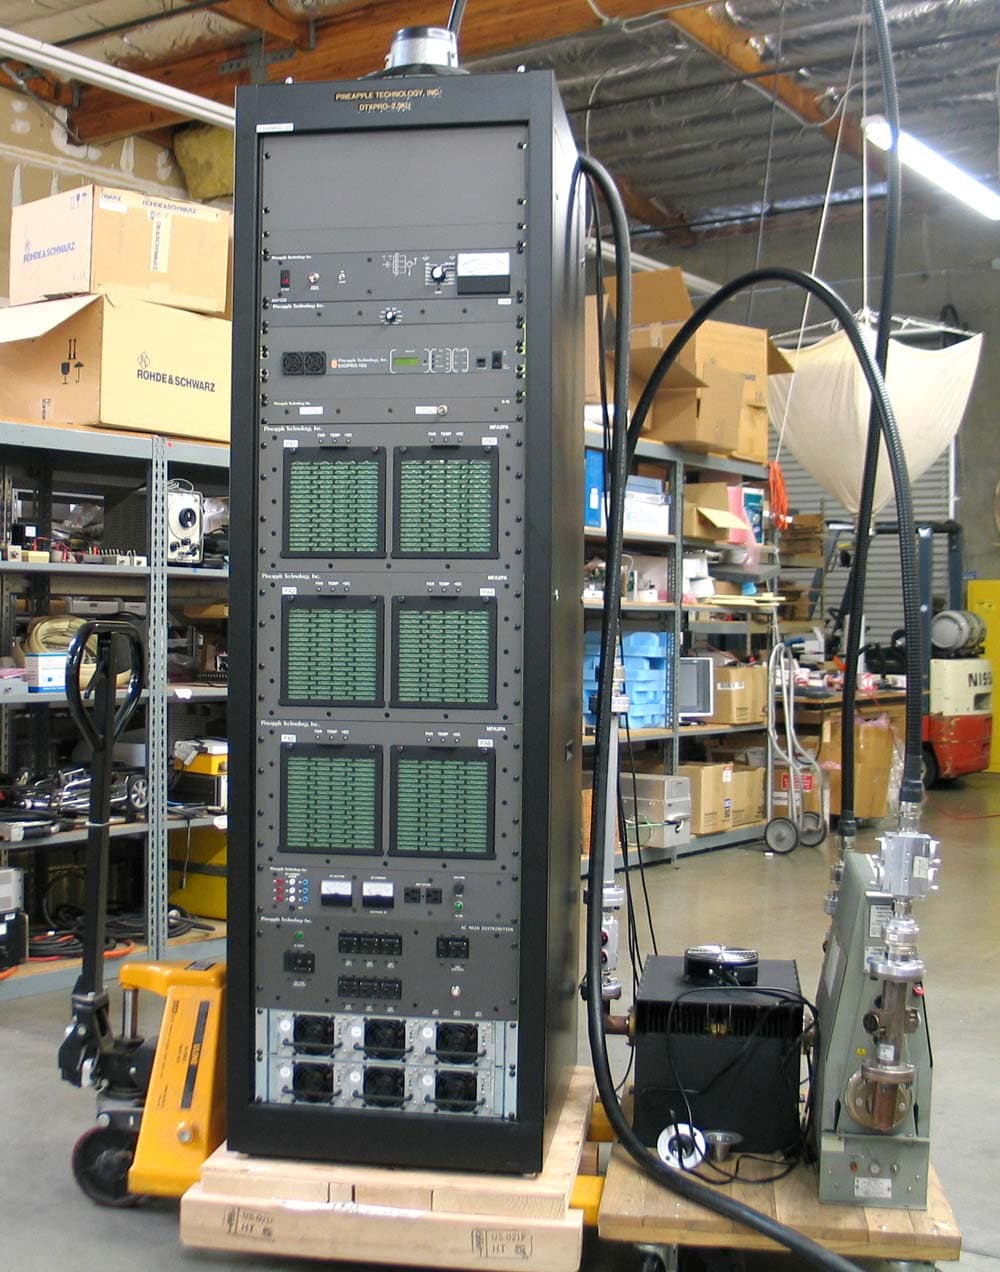
PW2DTXPRO2300U
Mar 01, 20112.3KW DTV TRANSMITTER
Equipment Class
TBC - Licensed Broadcast Station Transmitter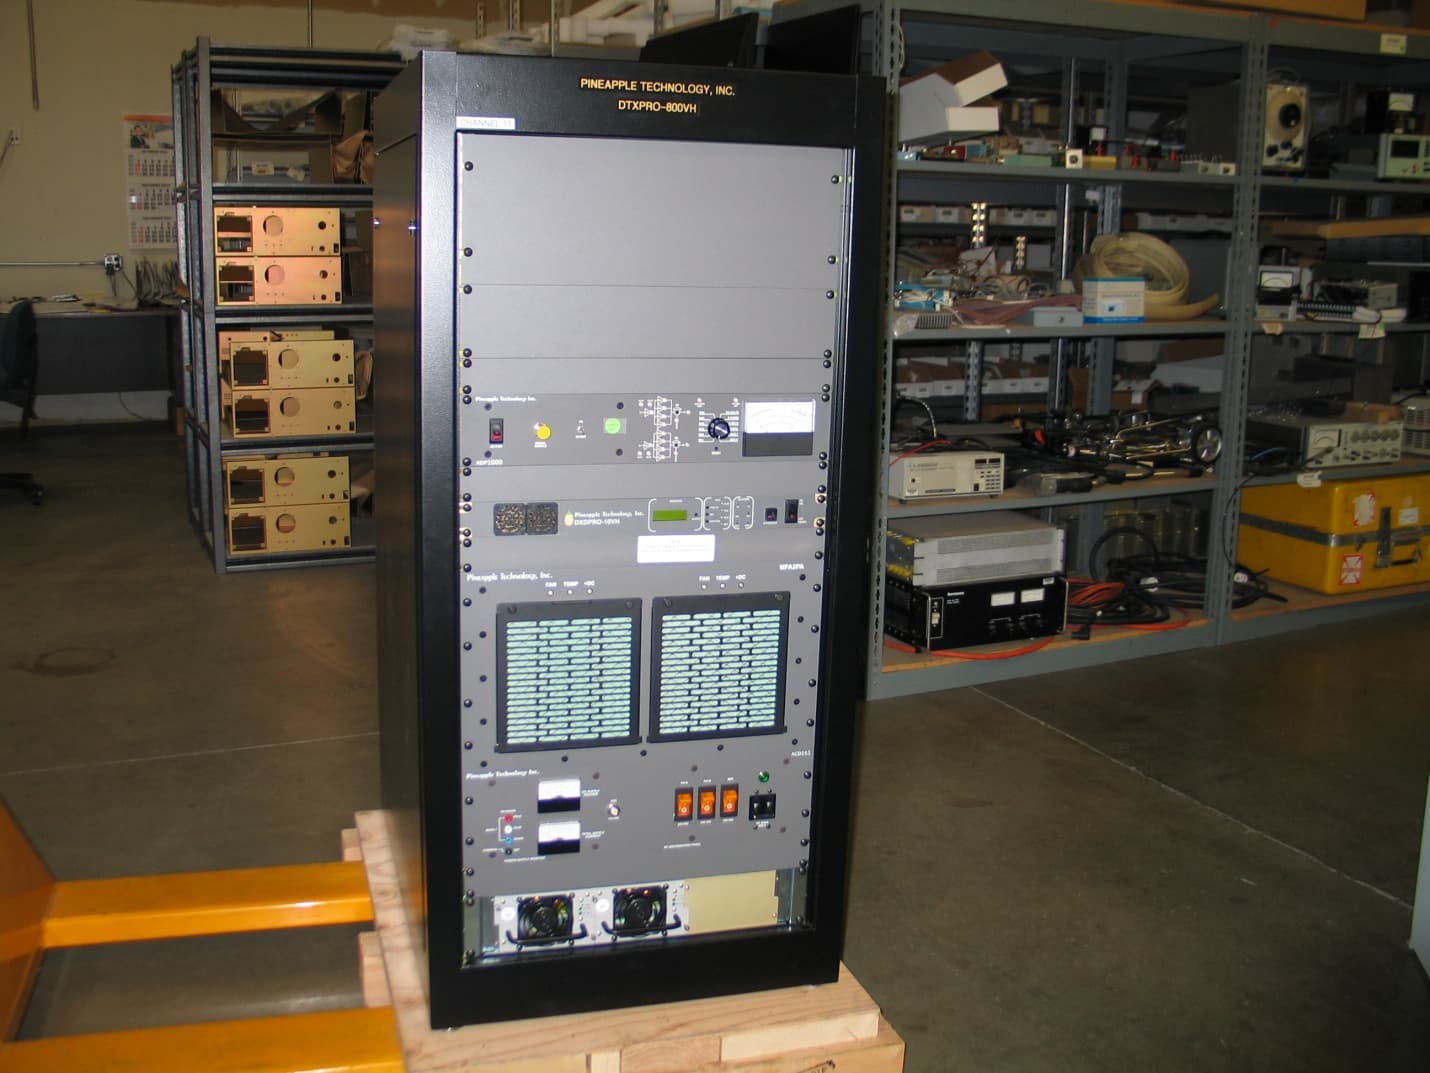
PW2DTXPRO800VH
Feb 27, 2011800 WATT DTV TRANSMITTER
Equipment Class
TBC - Licensed Broadcast Station Transmitter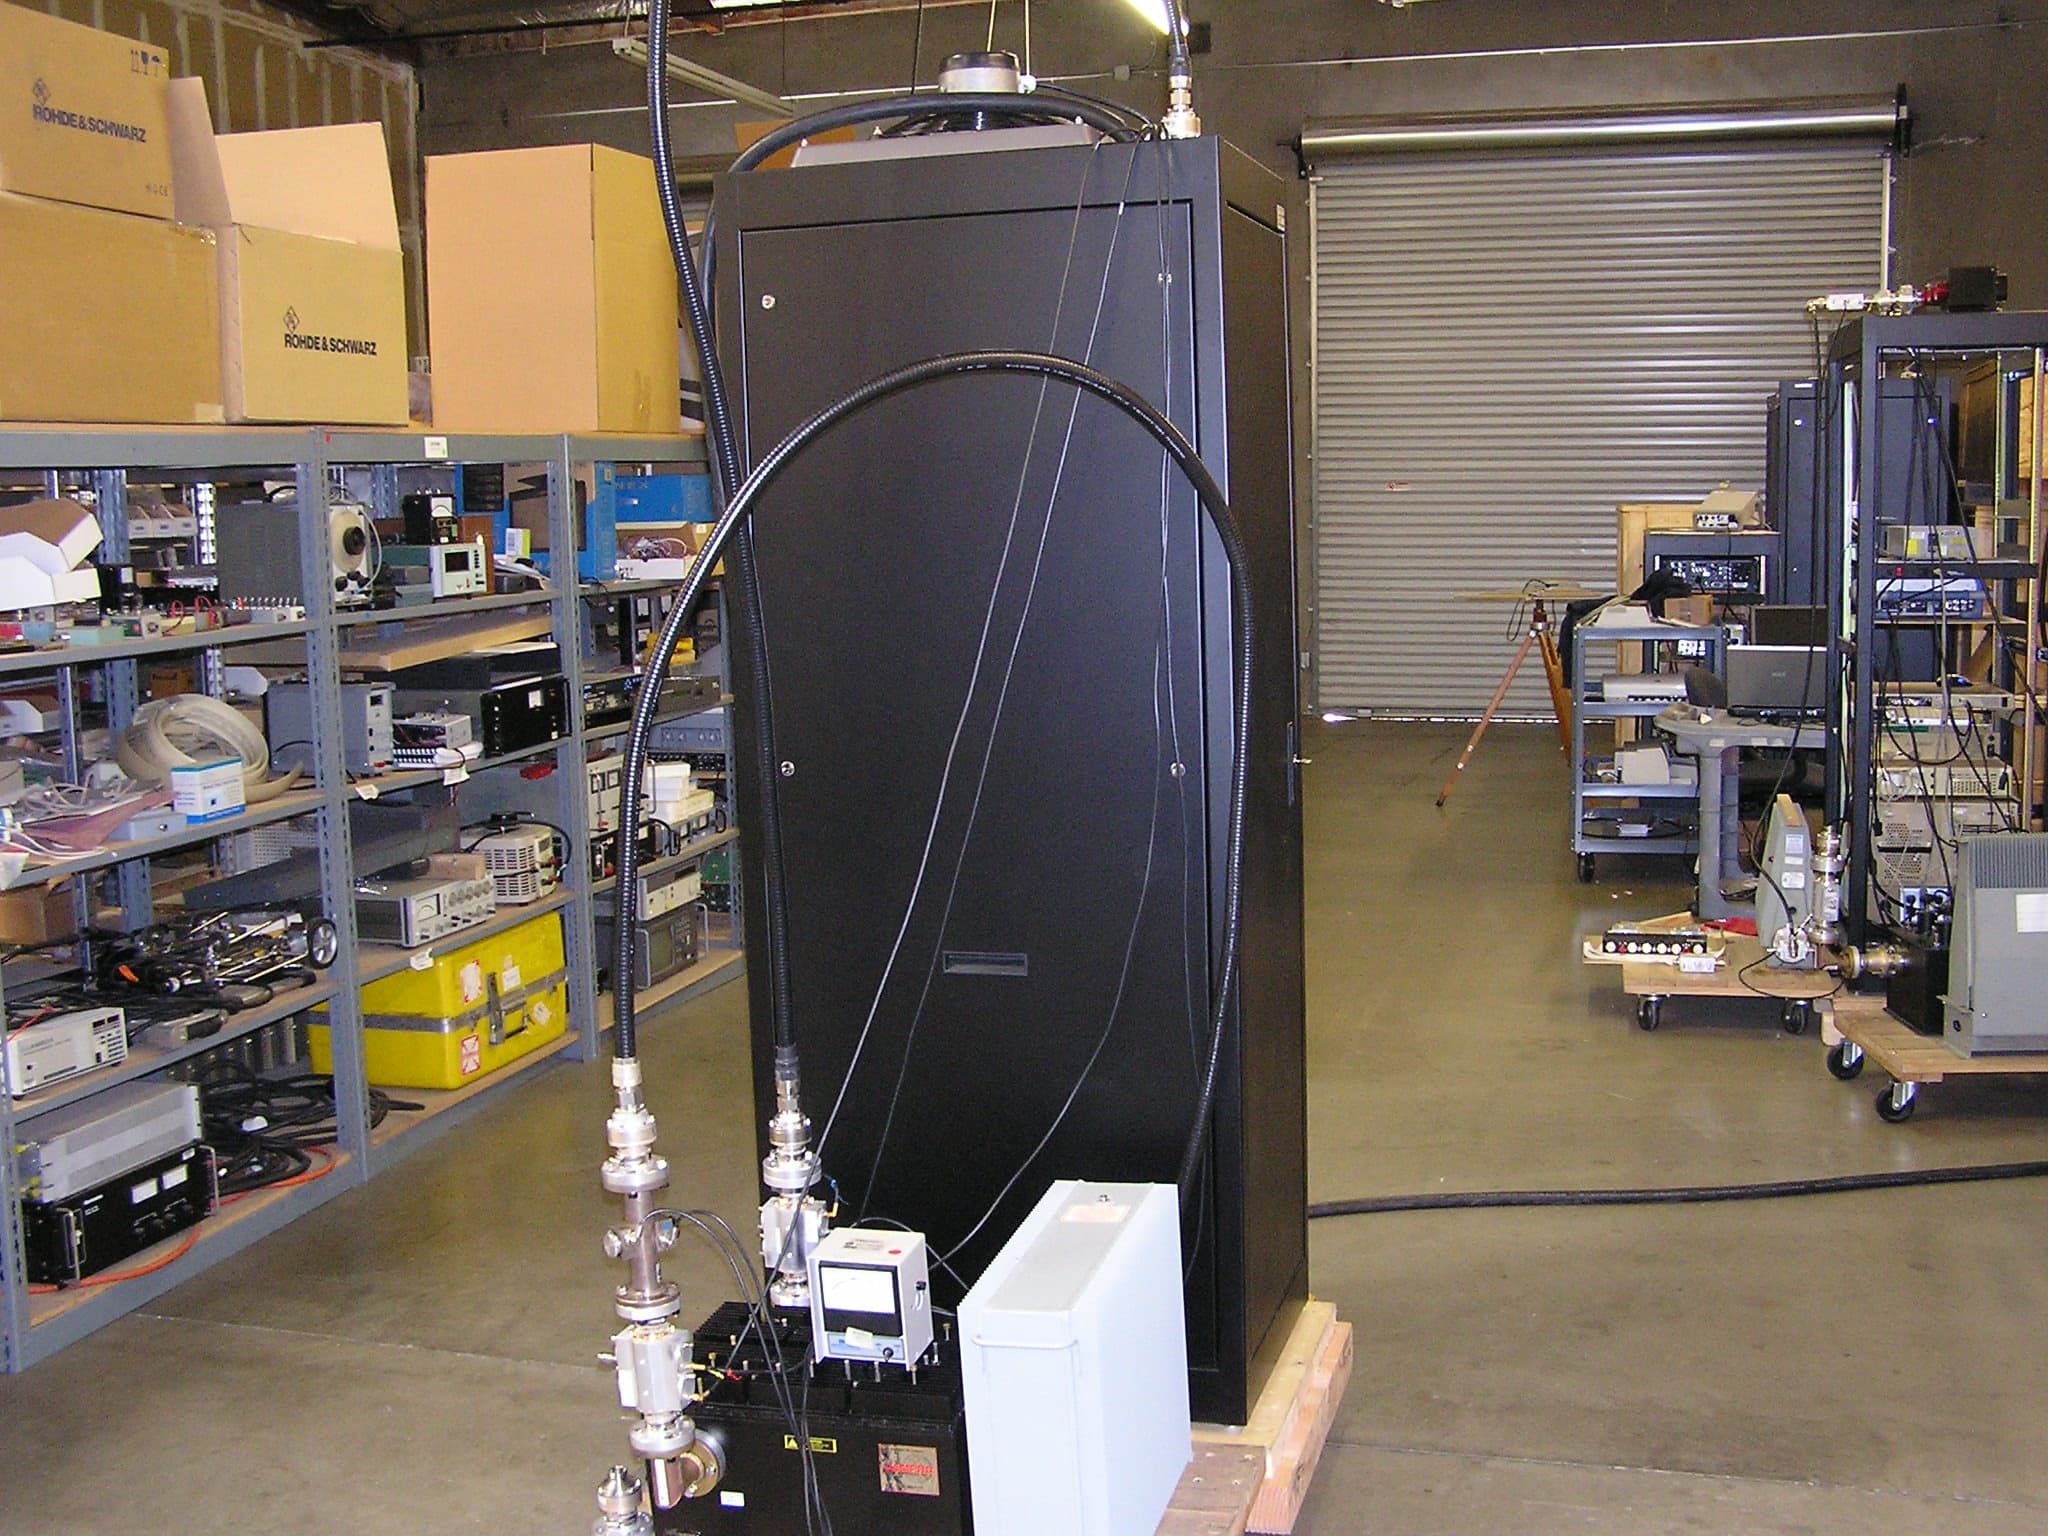
PW2DTXPRO1200U
Dec 12, 20101.2 KW DTV TRANSMITTER
Equipment Class
TBC - Licensed Broadcast Station Transmitter