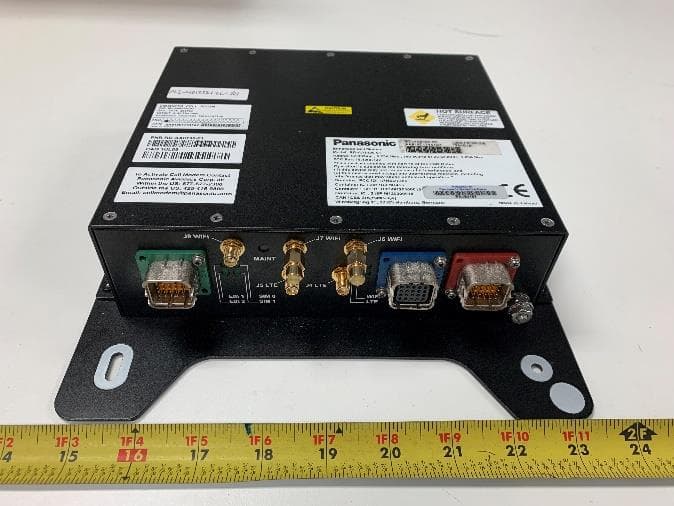
U6YRD-AA8101GSM Cellular Data Modem
Panasonic Avionics Corporation
Click to zoom
Application Details
- Equipment Class
- PCB - PCS Licensed Transmitter
- Date of Grant
- Oct 05, 2007
- Application Purpose
- Original Equipment
- Date of Application
- Oct 05, 2007
- Equipment Note
- GSM Cellular Data Modem
- Frequency Range
- 824.20000000 - 848.80000000
- Country
- United States
Documents & Files
Document Text
Text extracted from the exhibit documents filed with the FCC. Open a document above to read the original.
Users Manual
Panasonic Avionics Corporation The CM installer must consider the following criteria: 1) Position the antenna such that it is oriented vertically The modem assembly is mounted to a bracket using Nylatch fasteners. The orientation of the modem should be such that the antenna points up or points down. Because of the high multi-path within the aircraft, the orientation may be offset slightly from vertical without a substantial penalty in performance. 2) Position the antenna such that it is at least 2 cm from persons The modem assembly should be mounted behind a panel as a barrier to any human contact. There should be no possibility that the antenna could be contacted and possibly damaged. Because the antenna is hidden behind a panel, sufficient clearance must be provided to ensure inadvertent, incidental human exposure within 2 cm to any part of the antenna is not possible. 3) Provide a drip-shield if the CM is exposed to dripping water The modem assembly is not water-proof. If installed in a location where dripping water is possible, a drip shield must be installed above the modem, and appropriate drip loops applied to the cable assembly connecting to J1. 4) Avoid locations enclosed in conductive material The aircraft fuselage provides a conductive barrier to free-space radiation. The cabin windows, the doors and hatches, and other small penetrations provide a limited aperture for the cellular signal to propagate. In many cases, the modem assembly will be installed within a cabin monument or cabinet. It is strongly encouraged to have a minimum of one non-conductive surface near the cell modem (within the cabinet or monument) to allow for acceptable performance. While placing the modem wholly within a conductive enclosed monument has been shown to operate, the additional path loss will limit service only to airports with the strongest cellular service coverage. 5) Favor locations centrally positioned within large, open cabin areas Signal strength surveys have shown a clear trend that placing the cell modem assembly central to large open cabin areas has the best performance regardless of the direction to the servicing cellular base station. Alternatively, placing the modem within the galley, or in some cargo holds, has dramatically poorer performance. 6) The CM is stand-alone cooled allowing for compact installations with limited airflow The CM consumes about 10 W of power and has been shown to operate in constrained locations relying on stand- alone cooling between -15 to +70 deg. C.
External Photos
EMC Test Report No.: EMC_ PANA2_003_07001_FCC-22_24 Date of Report: 09/11/2007 External photos of EUT Page 1 of 3 Photo 1. Top view of the EUT Photo 2. Bottom view of the EUT EMC Test Report No.: EMC_ PANA2_003_07001_FCC-22_24 Date of Report: 09/11/2007 External photos of EUT Page 2 of 3 Photo 3. Front view of the EUT Photo 4. Back view of the EUT EMC Test Report No.: EMC_ PANA2_003_07001_FCC-22_24 Date of Report: 09/11/2007 External photos of EUT Page 3 of 3 Photo 5. Antenna side view of the EUT Photo 5. SIM card holder side view of the EUT
Internal Photos
EMC Test Report No.: EMC_ PANA2_003_07001_FCC-22_24 Date of Report: 09/11/2007 Internal photos of EUT Page 1 of 3 Photo 1. Top view of EUT’s PCB Board EMC Test Report No.: EMC_ PANA2_003_07001_FCC-22_24 Date of Report: 09/11/2007 Internal photos of EUT Page 2 of 3 Photo 2. MC75 GSM Module EMC Test Report No.: EMC_ PANA2_003_07001_FCC-22_24 Date of Report: 09/11/2007 Internal photos of EUT Page 3 of 3 Photo 3. Back view of EUT’s PCB board
Internal Photos
MC75: component side MC75: component side, shielding opened MC75: rear side
RF Exposure Info
SAR Test Report No.: SAR_PANA2_003_07001_Cell_Modem_GSM_FCC_rev.1 Date of Report: 10/04/2007 Appendix A Plots Page 1 of 19 System / software: SARA2 / 2.40 VPM Input Power Drift: Date / Time: 9/10/2007 5:11:32 PM DUT Battery Model/No: Filename: Side_190_3d.txt Probe Serial Number: M0024 Ambient Temperature: 22.8°C Liquid Simulant: 850 Device Under Test: Panasonic Avionics WAN Modem Relative Permittivity: 56.06 Relative Humidity: 30% Conductivity: 0.971 Phantom S/No: HeadBox2.csv Liquid Temperature: 22.0°C Phantom Rotation: 0° Max SAR X-axis Location: 0.00 mm DUT Position: Front 20mm Max SAR Y-axis Location: -4.00 mm Antenna Configuration: External Max E Field: 21.69 V/m Test Frequency: 824.2MHz SAR 1g: 0.505 W/kg Air Factors: 2685 / 2277 / 2238 SAR 10g: Conversion Factors: .355 / .355 / .355 SAR Start: 0.170 W/kg Type of Modulation: SAR End: 0.173 W/kg Modn. Duty Cycle: SAR Drift during Scan: 2.03 % Diode Compression Factors (V*200): 20 / 20 / 20 Probe battery last changed: 09/10/07 Input Power Level: Class 12, 2 Time Slots Extrapolation: poly4 SAR Test Report No.: SAR_PANA2_003_07001_Cell_Modem_GSM_FCC_rev.1 Date of Report: 10/04/2007 Appendix A Plots Page 2 of 19 System / software: SARA2 / 2.40 VPM Input Power Drift: Date / Time: 9/10/2007 4:32:07 PM DUT Battery Model/No: Filename: temp.txt Probe Serial Number: M0024 Ambient Temperature: 22.8°C Liquid Simulant: 850 Device Under Test: Panasonic Avionics WAN Modem Relative Permittivity: 55.71 Relative Humidity: 30% Conductivity: 0.989 Phantom S/No: HeadBox2.csv Liquid Temperature: 22.0°C Phantom Rotation: 0° Max SAR X-axis Location: -1.60 mm DUT Position: Front 20mm Max SAR Y-axis Location: 20.80 mm Antenna Configuration: External Max E Field: 28.34 V/m Test Frequency: 836.6MHz SAR 1g: 0.870 W/kg Air Factors: 2685 / 2277 / 2238 SAR 10g: Conversion Factors: .355 / .355 / .355 SAR Start: 0.270 W/kg Type of Modulation: SAR End: 0.271 W/kg Modn. Duty Cycle: SAR Drift during Scan: 0.37 % Diode Compression Factors (V*200): 20 / 20 / 20 Probe battery last changed: 09/10/07 Input Power Level: Class 12, 2 Time Slots Extrapolation: poly4 SAR Test Report No.: SAR_PANA2_003_07001_Cell_Modem_GSM_FCC_rev.1 Date of Report: 10/04/2007 Appendix A Plots Page 3 of 19 System / software: SARA2 / 2.40 VPM Input Power Drift: Date / Time: 9/10/2007 5:26:01 PM DUT Battery Model/No: Filename: Front_124_3d.txt Probe Serial Number: M0024 Ambient Temperature: 22.8°C Liquid Simulant: 850 Device Under Test: Panasonic Avionics WAN Modem Relative Permittivity: 55.47 Relative Humidity: 30% Conductivity: 0.982 Phantom S/No: HeadBox2.csv Liquid Temperature: 22.0°C Phantom Rotation: 0° Max SAR X-axis Location: -6.40 mm DUT Position: Front 20mm Max SAR Y-axis Location: -2.40 mm Antenna Configuration: External Max E Field: 21.67 V/m Test Frequency: 848.8MHz SAR 1g: 0.517 W/kg Air Factors: 2685 / 2277 / 2238 SAR 10g: Conversion Factors: .355 / .355 / .355 SAR Start: 0.166 W/kg Type of Modulation: SAR End: 0.168 W/kg Modn. Duty Cycle: SAR Drift during Scan: 1.20 % Diode Compression Factors (V*200): 20 / 20 / 20 Probe battery last changed: 09/10/07 Input Power Level: Class 12, 2 Time Slots Extrapolation: poly4 SAR Test Report No.: SAR_PANA2_003_07001_Cell_Modem_GSM_FCC_rev.1 Date of Report: 10/04/2007 Appendix A Plots Page 4 of 19 System / software: SARA2 / 2.40 VPM Input Power Drift: Date / Time: 9/10/2007 4:55:51 PM DUT Battery Model/No: Filename: Front_190_3d.txt Probe Serial Number: M0024 Ambient Temperature: 22.8°C Liquid Simulant: 850 Device Under Test: Panasonic Avionics WAN Modem Relative Permittivity: 55.71 Relative Humidity: 30% Conductivity: 0.989 Phantom S/No: HeadBox2.csv Liquid Temperature: 22.0°C Phantom Rotation: 0° Max SAR X-axis Location: 4.80 mm DUT Position: Side 20mm Max SAR Y-axis Location: -0.80 mm Antenna Configuration: External Max E Field: 23.99 V/m Test Frequency: 836.6MHz SAR 1g: 0.659 W/kg Air Factors: 2685 / 2277 / 2238 SAR 10g: Conversion Factors: .355 / .355 / .355 SAR Start: 0.222 W/kg Type of Modulation: SAR End: 0.225 W/kg Modn. Duty Cycle: SAR Drift during Scan: 1.35 % Diode Compression Factors (V*200): 20 / 20 / 20 Probe battery last changed: 09/10/07 Input Power Level: Class 12, 2 Time Slots Extrapolation: poly4 SAR Test Report No.: SAR_PANA2_003_07001_Cell_Modem_GSM_FCC_rev.1 Date of Report: 10/04/2007 Appendix A Plots Page 5 of 19 System / software: SARA2 / 2.40 VPM Input Power Drift: Date / Time: 9/11/2007 10:49:24 AM DUT Battery Model/No: Filename: Front_661_3d.txt Probe Serial Number: M0024 Ambient Temperature: 22.8°C Liquid Simulant: 1900 Device Under Test: Panasonic Avionics WAN Modem Relative Permittivity: 53.35 Relative Humidity: 30% Conductivity: 1.564 Phantom S/No: HeadBox2.csv Liquid Temperature: 22.0°C Phantom Rotation: 0° Max SAR X-axis Location: -1.60 mm DUT Position: Front 20mm Max SAR Y-axis Location: 26.40 mm Antenna Configuration: External Max E Field: 17.12 V/m Test Frequency: 1850.2MHz SAR 1g: 0.519 W/kg Air Factors: 2685 / 2277 / 2238 SAR 10g: Conversion Factors: .489 / .489 / .489 SAR Start: 0.224 W/kg Type of Modulation: SAR End: 0.226 W/kg Modn. Duty Cycle: SAR Drift during Scan: 0.96 % Diode Compression Factors (V*200): 20 / 20 / 20 Probe battery last changed: 09/11/07 Input Power Level: Class 12, 3 Time Slots Extrapolation: poly4 SAR Test Report No.: SAR_PANA2_003_07001_Cell_Modem_GSM_FCC_rev.1 Date of Report: 10/04/2007 Appendix A Plots Page 6 of 19 System / software: SARA2 / 2.40 VPM Input Power Drift: Date / Time: 9/11/2007 10:35:46 AM DUT Battery Model/No: Filename: temp.txt Probe Serial Number: M0024 Ambient Temperature: 22.8°C Liquid Simulant: 1900 Device Under Test: Panasonic Avionics WAN Modem Relative Permittivity: 53.16 Relative Humidity: 30% Conductivity: 1.577 Phantom S/No: HeadBox2.csv Liquid Temperature: 22.0°C Phantom Rotation: 0° Max SAR X-axis Location: 3.20 mm DUT Position: Front 20mm Max SAR Y-axis Location: -19.20 mm Antenna Configuration: External Max E Field: 15.98 V/m Test Frequency: 1880MHz S…
Text truncated - open the document above for the full version.
RF Exposure Info
SAR Test Report No: SAR_PANA2_003_07001_Cell_Modem_GSM_FCC_rev1 Date of Report: 10/04/2007 Appendix C Page 1 of 11 Tissue Parameters 850MHz Head liquid: Recipe: The following recipe is provided in percentage by weight. 49.46% distilled water 49.46% DGBE 1.0% salt 0.1% bactericide SAR measurements were made within 24 hours of the measurement of liquid parameters. Freq. Rel. Condy Date (MHz) Perm. (S/m) 09/10/2007 850 41.72 0.899 10/04/2007 835 42.31 0.918 10/04/2007 824.2 42.6 0.92 10/04/2007 836.6 42.28 0.918 10/04/2007 848.8 41.98 0.921 850MHz Body Liquid: Recipe: The following recipe is provided in percentage by weight. 49.8% distilled water 40.6% DGBE 8.9% salt 0.6% HEC 0.1% bactericide SAR measurements were made within 24 hours of the measurement of liquid parameters. Freq. Rel. Condy Date (MHz) Perm. (S/m) 09/10/2007 824 56.06 0.971 09/10/2007 836.6 55.71 0.989 09/10/2007 848 55.47 0.982 SAR Test Report No: SAR_PANA2_003_07001_Cell_Modem_GSM_FCC_rev1 Date of Report: 10/04/2007 Appendix C Page 2 of 11 1900MHz Head liquid: Recipe: The following recipe is provided in percentage by weight. 54.9% distilled water 44.92% DGBE 0.18% salt 0.1% bactericide SAR measurements were made within 24 hours of the measurement of liquid parameters. Freq. Rel. Condy Date (MHz) Perm. (S/m) 09/10/2007 1900 41.28 1.415 10/04/2007 1900 39.73 1.36 10/04/2007 1850.2 41.02 1.349 10/04/2007 1880 40.29 1.356 10/04/2007 1909.8 39373 1.362 1900MHz Body Liquid: Recipe: The following recipe is provided in percentage by weight. 69.17% distilled water 30.29% DGBE 0.44% salt 0.1% bactericide SAR measurements were made within 24 hours of the measurement of liquid parameters. Freq. Rel. Condy Date (MHz) Perm. (S/m) 09/10/2007 1850 53.35 1.564 09/10/2007 1880 53.16 1.577 09/10/2007 1910 52.97 1.578 SAR Test Report No: SAR_PANA2_003_07001_Cell_Modem_GSM_FCC_rev1 Date of Report: 10/04/2007 Appendix C Page 3 of 11 Test Equipment Test Equipment Model Serial Instrument description Supplier / Manufacturer Model Serial No. Calibration (date) Calibration Due (date) Bench top Robot Mitsubishi supplied by IndexSAR RV-E2 EA1030108 N/A N/A SAM Phantom Upright shell phantom made by Antennessa digitized and mounted by IndexSAR SAM 03FT26 04/03 N/A Flat Phantom IndexSAR HeadBox_1 N/A N/A N/A Software IndexSAR SARA2 v0.420 N/A N/A N/A 850 MHz Head Tissue Simulant Cetecom Inc. 850 Head N/A 09/10/2007 N/A 850 MHz Body Tissue Simulant Cetecom Inc. 850 Body N/A 09/10/2007 N/A 1900 MHz Head Tissue Simulant Cetecom Inc. 1900 Head N/A 09/10/2007 N/A 1900 MHz Body Tissue Simulant Cetecom Inc. 1900 Body N/A 09/10/2007 N/A 850 MHz Head Tissue Simulant Cetecom Inc. 850 Head N/A 10/04/2007 N/A 1900 MHz Head Tissue Simulant Cetecom Inc. 1900 Head N/A 10/04/2007 N/A 835 MHz Dipole IndexSAR – IEEE 1528 design IXDA-083 0016 08/14/2007 08/14/2008 1900 MHz Dipole IndexSAR – IEEE 1528 design IXDA-188 0016 08/15/2007 08/15/2008 Directional coupler Werlatone C6529 11249 N/A N/A RF Amplifier Vectawave VTL5400 N/A N/A N/A SAR Probe IndexSAR IXP-050 S/N 0016 10/20/2006 10/20/2007 SAR Probe IndexSAR IXP-030 S/N M0024 12/13/2006 12/13/2007 Dielectric Measurement Kit IndexSAR Di-Line N/A N/A N/A SAR Test Report No: SAR_PANA2_003_07001_Cell_Modem_GSM_FCC_rev1 Date of Report: 10/04/2007 Appendix C Page 4 of 11 Equipment Calibration/Performance Documents: Validation Dipoles Performance Measurements: Pages 5 to 11 Please Note: (The following pages of Appendix C show calibration documents. These calibration documents are inserted into this appendix. The header information with page numbering scheme is a part of this report and is included on all pages of the report and appendixes. This header is used to track all of the contents of this report.) SAR Test Report No: SAR_PANA2_003_07001_Cell_Modem_GSM_FCC_rev1 Date of Report: 10/04/2007 Appendix C Page 5 of 11 Report No. SN0016_090-180-190-245 July 1 st 2002 Revised 08/16/2007 INDEXSAR Validation Dipoles Type IXD-090, IXD-180, IXD-190 & IXD-245 Performance measurements S/N: 090-0016 S/N: 180-0016 S/N: 245-0016 S/N: 190-0016 MI Manning Indexsar, Oakfield House, Cudworth Lane, Newdigate, Surrey RH5 5DR. UK. Tel: +44 (0) 1306 631233 Fax: +44 (0) 1306 631834 e-mail: [email protected] SAR Test Report No: SAR_PANA2_003_07001_Cell_Modem_GSM_FCC_rev1 Date of Report: 10/04/2007 Appendix C Page 6 of 11 1. Measurement Conditions Measurements were performed using a box-shaped phantom made of PMMA with dimensions designed to meet the accuracy criteria for reasonably-sized phantoms that do not have liquid capacities substantially in excess of the volume of liquid required to fill the Indexsar upright SAM phantoms used for SAR testing of handsets against the ear. An HP 8753B vector network analyser was used for the return loss measurements. The dipole was placed in a special holder made of low-permittivity, low-loss materials. This holder enables the dipole to be positioned accurately in the centre of the base of the Indexsar box-phantom used for flat-surface testing and validation checks. The validation dipoles are supplied with special spacers made form a low-permittivity, low-loss foam material. These spacers are fitted to the dipole arms to ensure that, when the dipole is offered up to the phantom surface, the spacing between the dipole and the liquid surface is accurately aligned according to the guidance in the relevant standards documentation. The spacers are rectangular with a central hole equal to the dipole arm diameter and dimensioned so that the longer side can be used to ensure a spacing of 15mm from the liquid in the phantom (for tests at 900MHz and below) and the shorter side can be used for tests at 1800MHz and above to ensure a spacing of 10mm from the liquid in the phantom. The spacers are made on a CNC milling machine with an accuracy of 1/40 th mm but they may suffer wear and tear and need to be replaced periodically. The material used is Rohacell, which has a relative permittivity of approx. 1.05 and a negligi…
Text truncated - open the document above for the full version.
RF Exposure Info
SAR Test Report No.: SAR_PANA2_003_07001_Cell_Modem_GSM_FCC_rev.1 Date of Report:10/04/2007 Appendix B Page 1 of 3 Appendix B: Photos Photo 1. Front Position SAR Test Report No.: SAR_PANA2_003_07001_Cell_Modem_GSM_FCC_rev.1 Date of Report:10/04/2007 Appendix B Page 2 of 3 Photo 2. Side Position SAR Test Report No.: SAR_PANA2_003_07001_Cell_Modem_GSM_FCC_rev.1 Date of Report:10/04/2007 Appendix B Page 3 of 3 Photo 3: Photo to demonstrate 15 cm Z-axis flat phantom
RF Exposure Info
Page 1 of 20 IMMERSIBLE SAR PROBE CALIBRATION REPORT Part Number: IXP – 030 S/N M0024 December 2006 Indexsar Limited Oakfield House Cudworth Lane Newdigate Surrey RH5 5BG Tel: +44 (0) 1306 632 870 Fax: +44 (0) 1306 631 834 e-mail: [email protected] Page 2 of 20 Indexsar Limited Oakfield House Cudworth Lane Newdigate Surrey RH5 5BG Tel: +44 (0) 1306 632 870 Fax: +44 (0) 1306 631 834 e-mail: [email protected] Calibration Certificate 0612/M0024 Dosimetric E-field Probe Type: IXP-030 Manufacturer: IndexSAR, UK Serial Number: M0024 Place of Calibration: IndexSAR, UK IndexSAR Limited hereby declares that the IXP-030 Probe named above has been calibrated for conformity to the IEEE 1528 and CENELEC EN 50361 standards on the date shown below. Date of Initial Calibration: 13 th December 2006 The probe named above will require a calibration check on the date shown below. Next Calibration Date: December 2007 The calibration was carried out using the methods described in the calibration document. Where applicable, the standards used in the calibration process are traceable to the UK’s National Physical Laboratory. Calibrated By: Approved By: Please keep this certificate with the calibration document. When the probe is sent for a calibration check, please include the calibration document. Page 3 of 20 INTRODUCTION This Report presents measured calibration data for a particular Indexsar SAR probe (S/N M0024) and describes the procedures used for characterisation and calibration. Indexsar probes are characterised using procedures that, where applicable, follow the recommendations of CENELEC [1] and IEEE [2] standards. The procedures incorporate techniques for probe linearisation, isotropy assessment and determination of liquid factors (conversion factors). Calibrations are determined by comparing probe readings with analytical computations in canonical test geometries (waveguides) using normalised power inputs. Each step of the calibration procedure and the equipment used is described in the sections below. CALIBRATION PROCEDURE 1. Objectives The calibration process comprises four stages 1) Determination of the channel sensitivity factors which optimise the probe’s overall rotational isotropy in 1800MHz brain fluid 2) Determination of the channel sensitivity factors and angular offset of the X channel which together optimise the probe’s spherical isotropy in 1800MHz brain fluid 3) Numerical averaging of the two sets of channel sensitivity factors to give both acceptable rotational isotropy and acceptable spherical isotropy values 4) At each frequency of interest, application of these channel sensitivity factors to model the exponential decay of SAR in a waveguide fluid cell, and hence derive the liquid conversion factors at that frequency 2. Probe output The probe channel output signals are linearised in the manner set out in Refs [1] and [2]. The following equation is utilized for each channel: U lin = U o/p + U o/p 2 / DCP (1) where U lin is the linearised signal, U o/p is the raw output signal in voltage units and DCP is the diode compression potential in similar voltage units. DCP is determined from fitting equation (1) to measurements of U lin versus source feed power over the full dynamic range of the probe. The DCP is a characteristic of the Schottky diodes used as the sensors. For the IXP-030 probes with CW signals the DCP values are typically 0.10V (or 20 in the voltage units used by Indexsar software, which are V*200). Page 4 of 20 In turn, measurements of E-field are determined using the following equation (where output voltages are also in units of V*200): E liq 2 (V/m) = U linx * Air Factor x * Liq Factor x + U liny * Air Factor y * Liq Factor y + U linz * Air Factor z * Liq Factor z (3) Here, “Air Factor” represents each channel’s sensitivity, while “Liq Factor” represents the enhancement in signal level when the probe is immersed in tissue-simulant liquids at each frequency of interest. 3. Selecting channel sensitivity factors to optimise isotropic response After manufacture, the first stage of the calibration process is to balance the three channels’ Air Factor values, thereby optimising the probe’s overall axial response (“rotational isotropy”). To do this, a 1800MHz waveguide containing head-fluid simulant is selected. Like all waveguides used during probe calibration, this particular waveguide contains two distinct sections: an air-filled launcher section, and a liquid cell section, separated by a dielectric matching window designed to minimise reflections at the air-liquid interface. The waveguide stands in an upright position and the liquid cell section is filled with 1800MHz brain fluid to within 10 mm of the open end. The depth of liquid ensures there is negligible radiation from the waveguide open top and that the probe calibration is not influenced by reflections from nearby objects. During the measurement, a TE 01 mode is launched into the waveguide by means of an N-type-to-waveguide adapter. The probe is then lowered vertically into the liquid until the tip is exactly 10mm above the centre of the dielectric window. This particular separation ensures that the probe is operating in a part of the waveguide where boundary corrections are not necessary. Care must also be taken that the probe tip is centred while rotating. The exact power applied to the input of the waveguide during this stage of the probe calibration is immaterial since only relative values are of interest while the probe rotates. However, the power must be sufficiently above the noise floor and free from drift. The dedicated Indexsar calibration software rotates the probe in 10 degree steps about its axis, and at each position, an Indexsar ‘Fast’ amplifier samples the probe channels 500 times per second for 0.4 s. The raw U o/p data from each sample are packed into 10 bytes and transmitted back to the PC controller via an optical cable. U linx , U liny and U linz are derived from the raw U o/p values and…
Text truncated - open the document above for the full version.
RF Exposure Info
Bluetooth Qualification Test Facility (BQTF) FCC listed A2LA certified IC recognized # 3925A CETECOM Inc. 411 Dixon Landing Road Milpitas, CA 95035 U.S.A. Phone: + 1 (408) 586 6200 Fax: + 1 (408) 586 6299 E-mail: [email protected] http://www.cetecom.com CETECOM Inc. is a Delaware Corporation with Corporation number: 2113686 Board of Directors: Dr. Harald Ansorge, Dr. Klaus Matkey, Hans Peter May V.2.16M-2002-03-12 \\stupendousman\rootappsdata\emc\projects_emc\panasonic_avionics\pana2_003_07001_cell_modem\2_test _reports\sar\sar_pana2_003_07001_cell_modem_gsm_fcc_rev1.doc © Copyright by CETECOM SAR Test Report No.: SAR_PANA2_003_07001_Cell_Modem_GSM_FCC_rev.1 for the Panasonic Avionics Corporation GSM Cellular Data Modem Model Number: RD-AA8101 FCC ID: U6YRD-AA8101 IC-ID: NA Date of Report: 10/04/2007 Date of issue: 10/04/2007 SAR Test Report No. SAR_PANA2_003_07001_Cell_Modem_GSM_FCC_rev.1 Date of Report: 10/04/2007 Page 2 of 30 This report shall not be reproduced except in full without the written approval of: CETECOM Inc. SAR 411 Dixon Landing Road Milpitas, CA 95035 U.S.A. Contents 1 ASSESSMENT ...................................................................................................................4 2 ADMINISTRATIVE DATA...................................................................................................5 2.1 Identification of the Testing Laboratory Issuing the SAR Assessment Report ...............5 2.2 Identification of the Client...........................................................................................5 2.3 Identification of the Manufacturer...............................................................................5 3 EQUIPMENT UNDER INVESTIGATION (EUI)...................................................................6 3.1 Identification of the Equipment under Investigation ...................................................6 4 SUBJECT OF INVESTIGATION ........................................................................................7 4.1 The IEEE Standard C95.1 and the FCC Exposure Criteria .......................................7 4.2 Distinction Between Exposed Population, Duration of Exposure and Frequencies...7 4.3 Distinction between Maximum Permissible Exposure and SAR Limits......................8 4.4 SAR Limit ...................................................................................................................8 5 THE FCC MEASUREMENT PROCEDURE .......................................................................9 5.1 General Requirements...............................................................................................9 5.2 Body-worn and Other Configurations.......................................................................10 5.3 Procedure for assessing the peak spatial-average SAR .........................................10 5.4 Determination of the largest peak spatial-average SAR ..........................................12 6 THE MEASUREMENT SYSTEM ......................................................................................14 6.1 Robot system specification ......................................................................................14 6.2 Probe and amplifier specification .............................................................................15 6.3 Phantoms.................................................................................................................17 6.4 SAR measurement procedure .................................................................................18 6.5 SARA2 Interpolation and Extrapolation schemes ....................................................18 6.6 Interpolation of 2D area scan...................................................................................19 6.7 Extrapolation of 3D scan..........................................................................................19 6.8 Interpolation of 3D scan and volume averaging.......................................................19 SAR Test Report No. SAR_PANA2_003_07001_Cell_Modem_GSM_FCC_rev.1 Date of Report: 10/04/2007 Page 3 of 30 This report shall not be reproduced except in full without the written approval of: CETECOM Inc. SAR 411 Dixon Landing Road Milpitas, CA 95035 U.S.A. 7 UNCERTAINTY ASSESSMENT.......................................................................................21 7.1 Table of Measurement Uncertainty Values of SAR Evaluations..............................22 7.2 Table of Measurement Uncertainty Values for SAR System Verification ................23 8 TEST RESULTS SUMMARY............................................................................................24 8.1 Radiated Output Power............................................................................................24 8.2 Conducted Output Power.........................................................................................25 8.3 Test Positions and Configurations ...........................................................................26 8.4 WWAN Operating Mode ..........................................................................................26 8.5 850 MHz band GPRS Body SAR results for RD-AA8101........................................27 8.6 1900 MHz band GPRS Body SAR results for RD-AA8101......................................27 8.7 850 MHz band GPRS Head SAR results for RD-AA8101 .......................................28 8.8 1900 MHz band GPRS Head SAR results for RD-AA8101 .....................................28 8.9 Dipole Validation Check Results..............................................................................29 9 REFERENCES..................................................................................................................30 SAR Test Report No. SAR_PANA2_003_07001_Cell_Modem_GSM_FCC_rev.1 Date of Report: 10/04/2007 Page 4 of 30 This report shall not be reproduced except in full without the written approval o…
Text truncated - open the document above for the full version.
Test Report
Annex I: band edge compliance Measurement plots Test report reference: 4_SIEM_0504_GSM_FCCm Date: 2006-01-06 Annex I: band edge compliance - Measurement plots Test report reference: 4_SIEM_0504_GSM_FCCm Page 2 of 5 A 36 dB Offset Unit dBm EXT 1MAX1MA Start 823 MHzStop 824 MHz100 kHz/ Ref Lvl 35 dBm Ref Lvl 35 dBm RF Att 20 dBRBW 3 kHz VBW 3 kHz SWT 280 ms IN1 -60 -50 -40 -30 -20 -10 0 10 20 30 -65 35 1 Marker 1 [T1] -13.35 dBm 823.98196393 MHz 1 [T1] -13.35 dBm 823.98196393 MHz D1 -13 dBm Date: 21.DEC.2005 13:48:48 Test: band edge compliance , Channel 128, PCS Annex I: band edge compliance - Measurement plots Test report reference: 4_SIEM_0504_GSM_FCCm Page 3 of 5 A 36 dB Offset Unit dBm 1MAX1MA EXT Start 823 MHzStop 824 MHz100 kHz/ Ref Lvl 35 dBm Ref Lvl 35 dBm RBW 3 kHz VBW 3 kHz SWT 280 ms RF Att 20 dB IN1 -60 -50 -40 -30 -20 -10 0 10 20 30 -65 35 1 Marker 1 [T1] -20.91 dBm 823.99198397 MHz 1 [T1] -20.91 dBm 823.99198397 MHz D1 -13 dBm Date: 21.DEC.2005 14:09:20 Test: band edge compliance , Channel 128, EDGE Annex I: band edge compliance - Measurement plots Test report reference: 4_SIEM_0504_GSM_FCCm Page 4 of 5 A 36 dB Offset Unit dBm 1MAX1MA Ref Lvl 35 dBm Ref Lvl 35 dBm RF Att 20 dB EXT Start 849 MHzStop 850 MHz100 kHz/ RBW 3 kHz VBW 3 kHz SWT 280 ms IN1 -60 -50 -40 -30 -20 -10 0 10 20 30 -65 35 1 Marker 1 [T1] -13.13 dBm 849.02204409 MHz 1 [T1] -13.13 dBm 849.02204409 MHz D1 -13 dBm Date: 21.DEC.2005 13:50:36 Test: band edge compliance, Channel 251, PCS Annex I: band edge compliance - Measurement plots Test report reference: 4_SIEM_0504_GSM_FCCm Page 5 of 5 A 36 dB Offset Unit dBm 1MAX1MA EXT Start 849 MHzStop 850 MHz100 kHz/ Ref Lvl 35 dBm Ref Lvl 35 dBm RBW 3 kHz VBW 3 kHz SWT 280 ms RF Att 20 dB IN1 -60 -50 -40 -30 -20 -10 0 10 20 30 -65 35 1 Marker 1 [T1] -20.75 dBm 849.03006012 MHz 1 [T1] -20.75 dBm 849.03006012 MHz D1 -13 dBm Date: 21.DEC.2005 14:12:14 Test: band edge compliance, Channel 251, EDGE
Test Report
7 l…
Text truncated - open the document above for the full version.
Contact Information
Applicant
Hiro Masuda(Director, Product/Operations Quality)
Test Firm
CETECOM Inc.Meinolf Glunz
[email protected]408-586-6301
Technical Specifications
| # | Rule Parts | Frequency Range | Power Output | Emission | Tolerance |
|---|---|---|---|---|---|
| 4 | 22H | 824.2 MHz - 848.8 MHz | 650.00 mW | 300KG7W | 69 Hz |
Other Applications from Panasonic Avionics Corporation
U6YRDAA8190
Jul 14, 2021Enhanced Cell Modem
Equipment Class
NII - Unlicensed National Information Infrastructure TX
U6YRD-FA3221
Jun 04, 2007Premium Seat Electronics Box
Equipment Class
DTS - Digital Transmission System
U6YRD-FW7874
May 20, 2007SM-17 Smart Monitor
Equipment Class
NII - Unlicensed National Information Infrastructure TX