FDI-09102044-0802.11n Wireless PCI Adapter
BUFFALO INC.
Click to zoom
Application Details
- Equipment Class
- DTS - Digital Transmission System
- Date of Grant
- Jun 12, 2006
- Application Purpose
- Original Equipment
- Date of Application
- Jun 12, 2006
- Equipment Note
- 802.11n Wireless PCI Adapter
- Frequency Range
- 2412.00000000 - 2462.00000000
- Company
- BUFFALO INC.
- Country
- Japan
Documents & Files
Document Text
Text extracted from the exhibit documents filed with the FCC. Open a document above to read the original.
Users Manual
User Manual AirStation Nfi niti Wireless PCI Adapter WLI-PCI-G300N v. 1.0 2 • Insert the AirNavigator CD into the CD-ROM drive of your computer. The AirNavigator Setup Wizard should launch automatically. • To launch the AirNavigator Setup Wizard manually, click Start, then Run. Type “D:\ Setup.exe”, where D is the drive letter assigned to your CDrom. • Click OK to launch the wizard. Getting Started 3 • Select Install Wireless Drivers. Installing Wireless Drivers 4 • Click Next to install a driver for the PCI adaptor. • Select Agree and click Next to continue the process after reviewing the license agreemennt. • A window will appear prompting the installation of the Wireless PCI Adapter into the PC. You will need to shut down your PC to install the wireless PCI card. Press Cancel if necessary and shut down your PC. Installing Wireless Drivers 5 Shut down Windows and turn off your computer. Unplug the power cord from the surge protector or the power supply. Using a grounding wrist-strap attached to a metal part of the PC’s chassis, install the AirStation Card into an open PCI slot in your PC. You will probably have to remove a panel from your PC to access the PCI slots. Consult your PC’s user manual for instructions on adding a PCI card. After the card is installed and the PC’s case reassembled, screw each of the WLI-PCI- G300N’s antenna connectors to one of the RP-SMA connectors on the back of the card. Installing Your Wireless Card 6 • Restart your PC and let it boot up. • When the ‘Found New Hardware Wizard’ launches, click Next to run the wizard. • If the ‘Digital Signature Not Found’ page opens, click Yes. • When the Wireless PCI Adapter is successfully installed, click Finish. Reboot your computer if prompted. Installing Wireless Drivers 7 Connecting Wireless Clients to your Network Buffalo supports three different methods for connecting client devices like the WLI-PCI- G300N to your wireless network: Buffalo Client Manager - Install Buffalo’s Client Manager software to survey and connect to any supported wireless networks. Client Manager allows for detailed profiles to be configured for each connection. Please see page 8 for Client Manager installation instructions. AOSS - Buffalo’s pushbutton wireless setup technology allows for easy, secure connection to any AOSS compatable Router or AP. You will need to install Client Manager to use AOSS; please see page 8. After installation, please see page 11 for instructions on using AOSS. Windows XP Wireless Zero Confi g - Windows XP’s built in wireless configuration utility. This requires no additional software but doesn’t offer detailed profiles or AOSS. NOTE: Zero Config is only available on Windows XP. Please see page 21 for Zero Config instructions. 8 Client Manager can be used to survey and connect to available access points, confi gure WPA/WEP encryption, and create connection profi les. It also lets you use AOSS. Note: When Client Manager is installed, Windows XP Wireless Zero Confi guration is automatically disabled. Installing Client Manager Insert the AirNavigator CD into the CD- ROM drive of you computer. If the Air Navigator Setup Wizard does not launch automatically, launch it manually by clicking Start and then Run. Enter D:\ Setup.exe in the dialog box that appears. Click OK. Select Install Wireless Client Manager. Client Manager 9 Client Manager • Once the Client Manager Installer launches, click Next. • Press Agree to accept the license agreement and continue installation. 10 Client Manager • Click OK when Client Manager installation is complete. • Press Exit Setup to exit AirNavigator. • Client Manager is now installed and running. Right-click on its icon (the black antenna) to use it. 11 The AOSS button for this wireless client is in its Client Manager software. Start Client Manager by right clicking on the black antenna icon in your System Tray, or by launching the Client Manager from your Start Menu: Programs >> Buffalo >>AirStation Utility >> Client Manager. AOSS (AirStation One-Touch Secure System) is a simple, one-touch setup for connecting wireless clients to an access point while enforcing the most secure possible connection encryption type. Users no longer need to worry about choosing the proper security protocols, IP addresses, or SSID. AOSS determines the optimal connection and confi gures itself in seconds. If your router doesn’t support AOSS, turn to page 7 to confi gure your connection manually with Client Manager or Wireless Zero Confi g. Using AOSS 12 • From the Status Screen, select the Profi les tab. • Initiate AOSS by clicking the blue AOSS button on the Client Manager’s screen. The AOSS wizard will appear. • Now, press the AOSS button on the Access Point. Hold it down until the AOSS LED begins to fl ash. Using AOSS 13 Once AOSS is complete (about 30 seconds), the connection is archived as a profi le for later use. To minimize Client Manager to the system tray, click the ‘X’ in the top right corner. Notes: AOSS will scan for an AOSS partner for about two minutes. If it times out before fi nding one, just press the AOSS buttons again. Output power is reduced to 25% of normal during AOSS for security reasons. If you’re having trouble making an AOSS connection, temporarily move the devices closer together. AOSS will automatically use the highest level of security available for all currently connected wireless devices. If you have trouble connecting with AOSS, temorarily disable all personal fi rewalls on your PC, such as ZoneAlarm or Microsoft Personal Firewall. These programs may be re-enabled after AOSS has fi nished. Using AOSS 14 You may use Client Manager to confi gure your wireless network. Client Manager consists of the Status page, the Survey page, and the Profi les page. You can access each page by clicking the corresponding button on Client Manager. In addition to these pages, several dialog boxes are also available. You can access the Edit Profi le dialog box, New Profi le dialog box, IP Confi gu…
Text truncated - open the document above for the full version.
Cover Letter(s)
From: [email protected] [mailto:[email protected]] Sent: Monday, June 12, 2006 7:15 PM To: steve.cheng Subject: Re : TCB Review Comments for (A06-0525c- FDI-09102044-0- Buffalo 11nPCIAdapter) Dear Steve Pls see our reply as below: TCB Review Comments for (A06-0525c- FDI-09102044-0- Buffalo 11n PCI Adapter) -EMC- Question #1: P6 of test report, could 11g work on dual chain too? If not please modify the description. If yes, please supply test data. (Embedded image moved to file: pic26500.gif) ANS: The device can use only single chain in 11bg modes, please refer to revised test report. Question #2: Please revise test report, especially on power and PSD test, to have clearer test method and power combination scheme. ANS: Test report and RF Exposure report had been revised. Thanks for your assistance! Best Regards Wendy Liao Wendy Liao (廖意紋)/ ADT Corp. TEL: 03-318-3232 EXT 1625 FAX: 03-318-5050 Email: [email protected] 地址:桃園縣龜山鄉文化村華亞二路19號 "steve.cheng" <steve.cheng@nacs emc.com> 收件人 [email protected], [email protected] 2006/05/26 上午 副本抄送 04:45 [email protected] 主旨 TCB Review Comments for (A06-0525c- FDI-09102044-0- Buffalo 11n PCIAdapter) Best regards, Steve Cheng Curtis-Straus LLC Email: [email protected]
External Photos
Page 1 CONSTRUCTION PHOTOS OF EUT Page 2
ID Label/Location Info
FCC ID : FDI-09102044-0 Label Location
Internal Photos
Page 4 Page 5 Page 6
Operational Description
FCC ID: FDI-09102044-0 Report No.: RF950427L10 OPERATIONAL DESCRIPTION This device is a 802.11n Wireless PCI Adapter, which operates in the 2.4GHz frequency spectrum with throughput of up to 270Mbps which OFDM technique will be applied. If the signal to noise radio is too poor which could not support 300Mbps, the 11Mbps data rate with DSSS technique will be applied. The transmitter of the EUT is powered by AC adapter. The antenna is dipole antenna with R-SMA PLUG antenna connector. For more detailed instruction, please take a look at the user’s manual.
RF Exposure Info
FCC ID: FDI-09102044-0 Report No: SA950427L10 1 RF EXPOSURE REPORT REPORT NO.: SA950427L10 MODEL NO.: WLI-PCI-G300N ACCORDING: FCC Guidelines for Human Exposure IEEE C95.1 APPLICANT: Buffalo Inc. ADDRESS: 4-15, Shibata Hondori, Minami-ku, Nagoya 457- 8520, Japan ISSUED BY: Advance Data Technology Corporation LAB ADDRESS: No. 47, 14 th Ling, Chia Pau Tsuen, Lin Kou Hsiang 244, Taipei Hsien, Taiwan, R.O.C. TEST LOCATION: No. 19, Hwa Ya 2 nd Rd., Wen Hwa Tsuen, Kwei Shan Hsiang, Taoyuan Hsien 333, Taiwan, R.O.C. FCC ID: FDI-09102044-0 Report No: SA950427L10 2 RF EXPOSURE MEASUREMENT (MOBILE DEVICE) 1. INTRODUCTION In this document, we try to prove the safety of radiation harmfulness to the human body for our product. The limit for Maximum Permissible Exposure (MPE) specified in FCC 1.1310 is followed. The Gain of the antenna used in this product is measured in a Fully Anechoic Chamber (FAC) calibrated for antenna measurement in ADT, and also the maximum total power input to the antenna is measured. Through the Friis transmission formula and the maximum gain of the antenna, we can calculate the distance, away from the product, where the limit of MPE is reached. Although the Friis transmission formula is a far field assumption, the calculated result of that is an over-prediction for near field power density. We will take that as the worst case to specify the safety range. 2. RF EXPOSURE LIMIT According to FCC 1.1310: The criteria listed in the following table shall be used to evaluate the environmental impact of human exposure to radio-frequency (RF) radiation as specified in 1.1307(b) LIMITS FOR MAXIMUM PERMISSIBLE EXPOSURE (MPE) FREQUENCY RANGE (MHz) ELECTRIC FIELD STRENGTH (V/m) MAGNETIC FIELD STRENGTH (A/m) POWER DENSITY (mW/cm 2 ) AVERAGE TIME (minutes) (A)LIMITS FOR OCCUPATIONAL / CONTROL EXPOSURES 300-1500......F/3006 1500-100,000......56 (B)LIMITS FOR GENERAL POPULATION / UNCONTROLLED EXPOSURE 300-1500......F/15006 1500-100,000......1.030 F = Frequency in MHz FCC ID: FDI-09102044-0 Report No: SA950427L10 3 3. FRIIS FORMULA Friis transmission formula : Pd = (Pout*G) / (4*pi*r 2 ) where Pd = power density in mW/cm 2 Pout = output power to antenna in mW G = gain of antenna in linear scale Pi = 3.1416 R = distance between observation point and center of the radiator in cm If we know the maximum Gain of the antenna and the total power input to the antenna, through the calculation, we will know the MPE value at distance r. Ref.: David K. Cheng, Field and Wave Electromagnetics, Second Edition, Page 640, Eq. (11-133). 4. EUT OPERATING CONDITION The software provided by Manufacturer enabled the EUT to transmit and receive data at lowest, middle and highest channel individually. 5. CLASSIFICATION This device is fixed inside the host equipment. Warning statement to the user for keeping at least 20cm or more separation distance with the antenna should be included in users manual. So, this device is classified as Mobile Device. FCC ID: FDI-09102044-0 Report No: SA950427L10 4 6. TEST RESULTS 6.1 ANTENNA GAIN The maximum Gain measured in Fully Anechoic Chamber is 1.79dBi or 1.510 (numeric). 6.2 OUTPUT POWER INTO ANTENNA & RF EXPOSURE VALUE AT DISTANCE 20cm: 802.11b DSSS MODULATION: CHANNEL CHANNEL FREQUENCY (MHz) TOTAL OUTPUT POWER TO ANTENNA (mW) POWER DENSITY (mW/cm 2 ) LIMIT OF POWER DENSITY (mW/cm 2 ) 12412 101.1580.030 1.0 62437 178.2380.054 1.0 112462 68.7070.021 1.0 802.11g OFDM modulation: CHANNEL CHANNEL FREQUENCY (MHz) TOTAL OUTPUT POWER TO ANTENNA (mW) POWER DENSITY (mW/cm 2 ) LIMIT OF POWER DENSITY (mW/cm 2 ) 12412130.9180.0391.0 62437181.9700.0551.0 112462102.3290.0311.0 FCC ID: FDI-09102044-0 Report No: SA950427L10 5 DRAFT 802.11n (20MHz) OFDM modulation - DUAL TX PEAK POWER OUTPUT (mW) PEAK POWER OUTPUT (dBm) CHANNEL CHANNEL FREQUENCY (MHz) CHAIN 0 CHAIN 1 CHAIN 0 CHAIN 1 TOTAL PEAK POWER (mW) TOTAL PEAK POWER (dBm) POWER DENSITY (mW/CM2)) LIMIT OF POWER DENSITY (mW/CM2) 1 241280.72479.79919.0719.02160.52322.060.0481.0 62437159.956159.22122.0422.02319.17725.040.0961.0 11246280.35379.61619.0519.01159.96922.040.0481.0 DRAFT 802.11n (40MHz) OFDM modulation - DUAL TX PEAK POWER OUTPUT (mW) PEAK POWER OUTPUT (dBm) CHANNEL CHANNEL FREQUENCY (MHz) CHAIN 0 CHAIN 1 CHAIN 0 CHAIN 1 TOTAL PEAK POWER (mW) TOTAL PEAK POWER (dBm) POWER DENSITY (mW/CM2)) LIMIT OF POWER DENSITY (mW/CM2) 1242271.45071.45018.5418.54142.89921.550.0431.0 4243789.95089.74319.5419.53179.69322.550.0541.0 7245261.37660.95417.8817.85122.33020.880.0371.0
Test Report
Report No.: RF950427L101Report Format Version 2.0.4 FCC TEST REPORT REPORT NO.: RF950427L10 MODEL NO.: WLI-PCI-G300N RECEIVED: Apr. 21, 2006 TESTED: Apr. 21 ~ May 06, 2006 ISSUED: May 09, 2006 APPLICANT:Buffalo Inc. ADDRESS:4-15, Shibata Hondori, Minami-ku, Nagoya 457- 8520, Japan ISSUED BY:Advance Data Technology Corporation LAB ADDRESS:No. 47, 14 th Ling, Chia Pau Tsuen, Lin Kou Hsiang, Taipei Hsien, Taiwan, R.O.C. TEST LOCATION: No. 19, Hwa Ya 2 nd Rd., Wen Hwa Tsuen, Kwei Shan Hsiang, Taoyuan Hsien 333, Taiwan, R.O.C. This test report consists of 105 pages in total. It may be duplicated completely for legal use with the approval of the applicant. It should not be reproduced except in full, without the written approval of our laboratory. The client should not use it to claim product endorsement by CNLA, A2LA or any government agencies. The test results in the report only apply to the tested sample. Report No.: RF950427L102Report Format Version 2.0.4 TABLE OF CONTENTS 1.CERTIFICATION ..................................................................................................4 2.SUMMARY OF TEST RESULTS ..........................................................................5 2.1 MEASUREMENT UNCERTAINTY ........................................................................5 3.GENERAL INFORMATION ...................................................................................6 3.1GENERAL DESCRIPTION OF EUT .....................................................................6 3.2DESCRIPTION OF TEST MODES .......................................................................7 3.2.1CONFIGURATION OF SYSTEM UNDER TEST...................................................7 3.2.2TEST MODE APPLICABILITY AND TESTED CHANNEL DETAIL ........................8 3.3GENERAL DESCRIPTION OF APPLIED STANDARDS .....................................10 3.4DESCRIPTION OF SUPPORT UNITS................................................................10 4.TEST TYPES AND RESULTS ............................................................................ 11 4.1CONDUCTED EMISSION MEASUREMENT ...................................................... 11 4.1.1LIMITS OF CONDUCTED EMISSION MEASUREMENT.................................... 11 4.1.2TEST INSTRUMENTS........................................................................................ 11 4.1.3TEST PROCEDURES ........................................................................................12 4.1.4DEVIATION FROM TEST STANDARD ...............................................................12 4.1.5TEST SETUP .....................................................................................................13 4.1.6EUT OPERATING CONDITIONS........................................................................13 4.1.7TEST RESULTS .................................................................................................14 4.2RADIATED EMISSION MEASUREMENT ...........................................................32 4.2.1LIMITS OF RADIATED EMISSION MEASUREMENT.........................................32 4.2.2TEST INSTRUMENTS........................................................................................33 4.2.3TEST PROCEDURES ........................................................................................34 4.2.4DEVIATION FROM TEST STANDARD ...............................................................34 4.2.5TEST SETUP .....................................................................................................35 4.2.6EUT OPERATING CONDITIONS........................................................................35 4.2.7TEST RESULTS .................................................................................................36 4.36dB BANDWIDTH MEASUREMENT ..................................................................51 4.3.1LIMITS OF 6dB BANDWIDTH MEASUREMENT ................................................51 4.3.2TEST INSTRUMENTS........................................................................................51 4.3.3TEST PROCEDURE...........................................................................................51 4.3.4DEVIATION FROM TEST STANDARD ...............................................................51 4.3.5TEST SETUP .....................................................................................................52 Report No.: RF950427L103Report Format Version 2.0.4 4.3.6EUT OPERATING CONDITIONS........................................................................52 4.3.7TEST RESULTS .................................................................................................53 4.4MAXIMUM PEAK OUTPUT POWER ..................................................................65 4.4.1LIMITS OF MAXIMUM PEAK OUTPUT POWER MEASUREMENT ...................65 4.4.2INSTRUMENTS..................................................................................................65 4.4.3TEST PROCEDURES ........................................................................................65 4.4.4DEVIATION FROM TEST STANDARD ...............................................................65 4.4.5TEST SETUP .....................................................................................................66 4.4.6EUT OPERATING CONDITIONS........................................................................66 4.4.7TEST RESULTS .................................................................................................67 4.5POWER SPECTRAL DENSITY MEASUREMENT..............................................69 4.5.1LIMITS OF POWER SPECTRAL DENSITY MEASUREMENT............................69 4.5.2TEST INSTRUMENTS........................................................................................69 4.5.3TEST PROCEDURE...........................................................................................69 4.5.4DEVIATION FROM TEST STANDARD ......................................................…
Text truncated - open the document above for the full version.
Test Report
Report No.: RF950427L1081Report Format Version 2.0.4 FOR CHAIN 1: CH 1 CH 4 Report No.: RF950427L1082Report Format Version 2.0.4 CH 7 Report No.: RF950427L1083Report Format Version 2.0.4 4.6 BAND EDGES MEASUREMENT 4.6.1 LIMITS OF BAND EDGES MEASUREMENT Below –20dB of the highest emission level of operating band (in 100kHz Resolution Bandwidth). 4.6.2 TEST INSTRUMENTS DESCRIPTION & MANUFACTURER MODEL NO.SERIAL NO.CALIBRATED UNTIL R&S SPECTRUM ANALYZER FSEK30100049Aug. 14, 2006 NOTE: The calibration interval of the above test instruments is 12 months and the calibrations are traceable to NML/ROC and NIST/USA. Report No.: RF950427L1084Report Format Version 2.0.4 4.6.3 TEST PROCEDURE For Single TX: The transmitter output was connected to the spectrum analyzer via a low lose cable. Set both RBW and VBW of spectrum analyzer to 100kHz with suitable frequency span including 10Hz bandwidth from band edge. The band edges was measured and recorded. The spectrum plots (Peak RBW = VBW = 100kHz; Average RBW = 1MHz, VBW = 10Hz are attached on the following pages. For Dual TX: a. The EUT was placed on the top of a rotating table 0.8 meters above the ground at a 3 meter semi-anechoic chamber. The table was rotated 360 degrees to determine the position of the highest radiation. b. The EUT was set 3 meters away from the interference-receiving antenna, which was mounted on the top of a variable-height antenna tower. c. The antenna is a broadband antenna, and its height is varied from one meter to four meters above the ground to determine the maximum value of the field strength. Both horizontal and vertical polarizations of the antenna are set to make the measurement. d. For each suspected emission, the EUT was arranged to its worst case and then the antenna was tuned to heights from 1 meter to 4 meters and the rotatable table was turned from 0 degrees to 360 degrees to find the maximum reading. e. Set both RBW and VBW of spectrum analyzer to 100kHz with suitable frequency span including 100MHz bandwidth from band edge. The band edges was measured and recorded. The spectrum plots (Peak RBW = VBW = 100kHz; Average RBW = 1MHz, VBW = 100Hz) NOTE: The resolution bandwidth of test receiver/spectrum analyzer is 1 MHz and the video bandwidth is 100Hz for Average detection (AV) at frequency above 1GHz. 4.6.4 DEVIATION FROM TEST STANDARD No deviation 4.6.5 EUT OPERATING CONDITION Same as Item 4.3.6 Report No.: RF950427L1085Report Format Version 2.0.4 4.6.6 TEST RESULTS The spectrum plots are attached on the following 12 images. D1 line indicates the highest level, and D2 line indicates the 20dB offset below D1. It shows compliance with the requirement in part 15.247(d). 802.11b DSSS MODULATION: NOTE 1: The band edge emission plot of DSSS technique on the next page shows 51.52dBc between carrier maximum power and local maximum emission in restrict band (2.3874GHz). The emission of carrier strength list in the test result of channel 1 at the item 4.2.7 is 110.20dBuV/m (Peak), so the maximum field strength in restrict band is 110.20 – 51.52 = 58.68dBuV/m which is under 74dBuV/m limit. The band edge emission plot of DSSS technique on the next page shows 52.91dBc between carrier maximum power and local maximum emission in restrict band (2.3874GHz). The emission of carrier strength list in the test result of channel 1 at the item 4.2.7 is 106.84dBuV/m (Average), so the maximum field strength in restrict band is 106.84 – 52.91 = 53.93dBuV/m which is under 54dBuV/m limit. NOTE 2: The band edge emission plot of DSSS technique on the next second page shows 52.02dBc between carrier maximum power and local maximum emission in restrict band (2.4835GHz). The emission of carrier strength list in the test result of channel 11 at the item 4.2.7 is 108.58dBuV/m (Peak), so the maximum field strength in restrict band is 108.58 – 52.02 = 56.56dBuV/m which is under 74dBuV/m limit. The band edge emission plot of DSSS technique on the next third page shows 53.51dBc between carrier maximum power and local maximum emission in restrict band (2.4861GHz). The emission of carrier strength list in the test result of channel 11 at the item 4.2.7 is 104.82dBuV/m (Average), so the maximum field strength in restrict band is 104.82 – 53.51 = 51.31dBuV/m which is under 54dBuV/m limit. Report No.: RF950427L1086Report Format Version 2.0.4 Report No.: RF950427L1087Report Format Version 2.0.4 Report No.: RF950427L1088Report Format Version 2.0.4 Report No.: RF950427L1089Report Format Version 2.0.4 802.11g OFDM MODULATION: NOTE 1: The band edge emission plot of OFDM technique on the next page shows 45.08dBc between carrier maximum power and local maximum emission in restrict band (2.3900GHz). The emission of carrier strength list in the test result of channel 1 at the item 4.2.7 is 111.73dBuV/m (Peak), so the maximum field strength in restrict band is 111.73 – 45.08 = 66.65dBuV/m which is under 74dBuV/m limit. The band edge emission plot of OFDM technique on the next page shows 49.37dBc between carrier maximum power and local maximum emission in restrict band (2.3900GHz). The emission of carrier strength list in the test result of channel 1 at the item 4.2.7 is 101.62dBuV/m (Average), so the maximum field strength in restrict band is 101.62 – 49.37 = 52.25dBuV/m which is under 54dBuV/m limit. NOTE 2: The band edge emission plot of OFDM technique on the next second page shows 45.54dBc between carrier maximum power and local maximum emission in restrict band (2.4851GHz). The emission of carrier strength list in the test result of channel 11 at the item 4.2.7 is 109.96dBuV/m (Peak), so the maximum field strength in restrict band is 109.96 – 45.54 = 64.42dBuV/m which is under 74dBuV/m limit. The band edge emission plot of OFDM technique on the next third page shows 47.41dBc between carrier maximum power and local maximum emission in restrict band (2.4835GHz). The emission of carrier strength list in the test result of channel 11 at the item 4.2.7 is 100.33dBuV/m …
Text truncated - open the document above for the full version.
Test Setup Photos
Report No.: RF950427L10102Report Format Version 2.0.4 5. PHOTOGRAPHS OF THE TEST CONFIGURATION CONDUCTED EMISSION TEST Report No.: RF950427L10103Report Format Version 2.0.4 RADIATED EMISSION TEST
Contact Information
Applicant
Mr. Masaya Ishimaru(General Manager)
Technical Contact
Advance Data Technology Corporation (Hwa Ya)Gary Chang
[email protected]886-3-3183232
No. 19, Hwa Ya 2nd Rd., Kwei Shan Hsiang · Taoyuan Hsien · Taiwan
Non-Technical Contact
Advance Data Technology CorporationEllis Wu
[email protected]886-3-3183232
Test Firm
Bureau Veritas CPS (H.K.) Ltd. Taoyuan BranchRichard Chen
Technical Specifications
| # | Rule Parts | Frequency Range | Power Output |
|---|---|---|---|
| 1 | 15C | 2.41 GHz - 2.46 GHz | 319.00 mW |
Other Applications from BUFFALO INC.
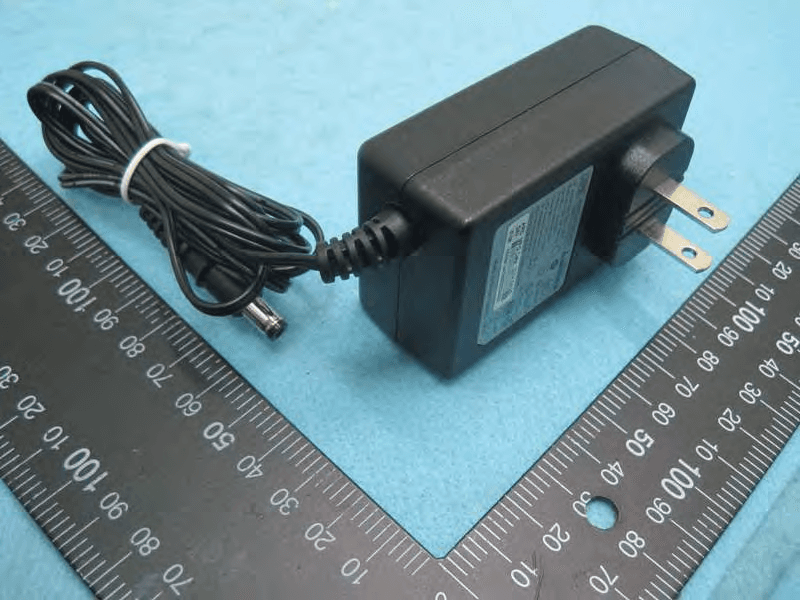
FDI000000028
Mar 15, 2015AirStation
Equipment Class
DTS - Digital Transmission System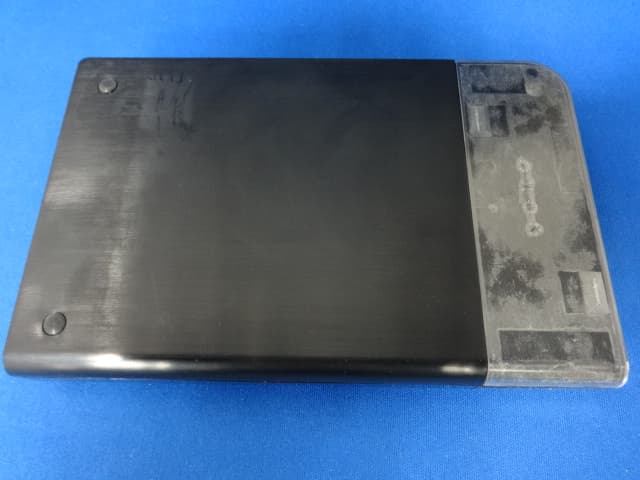
FDI000000027
Jan 22, 2015MiniStation
Equipment Class
DXX - Part 15 Low Power Communication Device Transmitter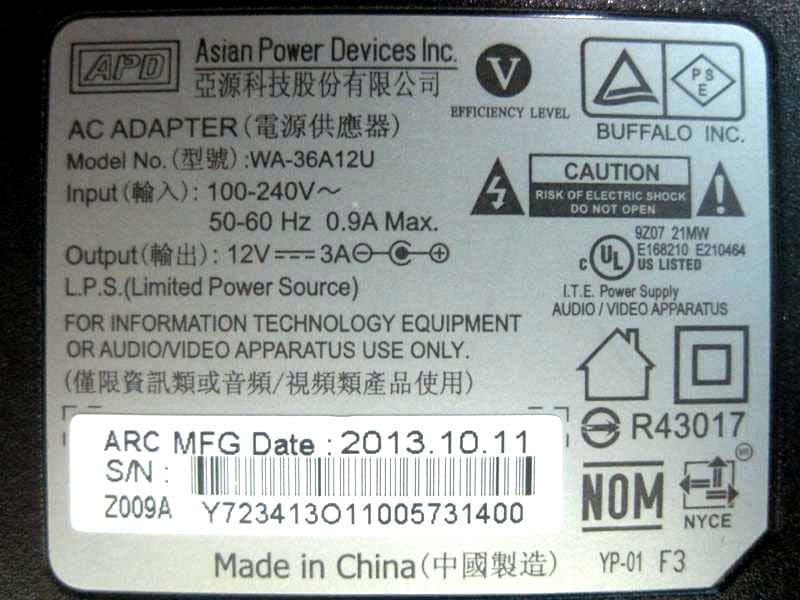
FDI000000022
Oct 12, 2014AirStation
Equipment Class
DTS - Digital Transmission System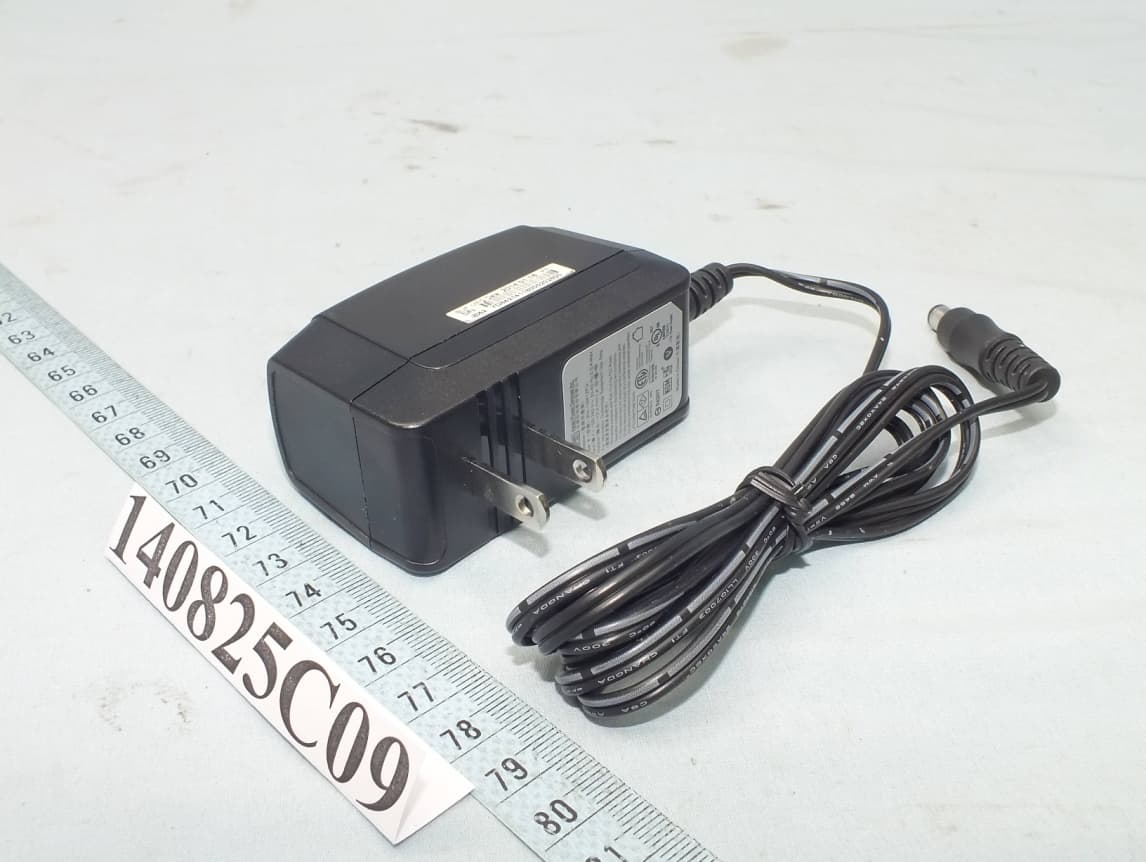
FDI000000026
Oct 01, 2014AirStation
Equipment Class
DTS - Digital Transmission System
FDI000000024
Apr 21, 2014AirStation
Equipment Class
DTS - Digital Transmission System