SHD-A4YWFSHandheld Computer
OQO, Inc.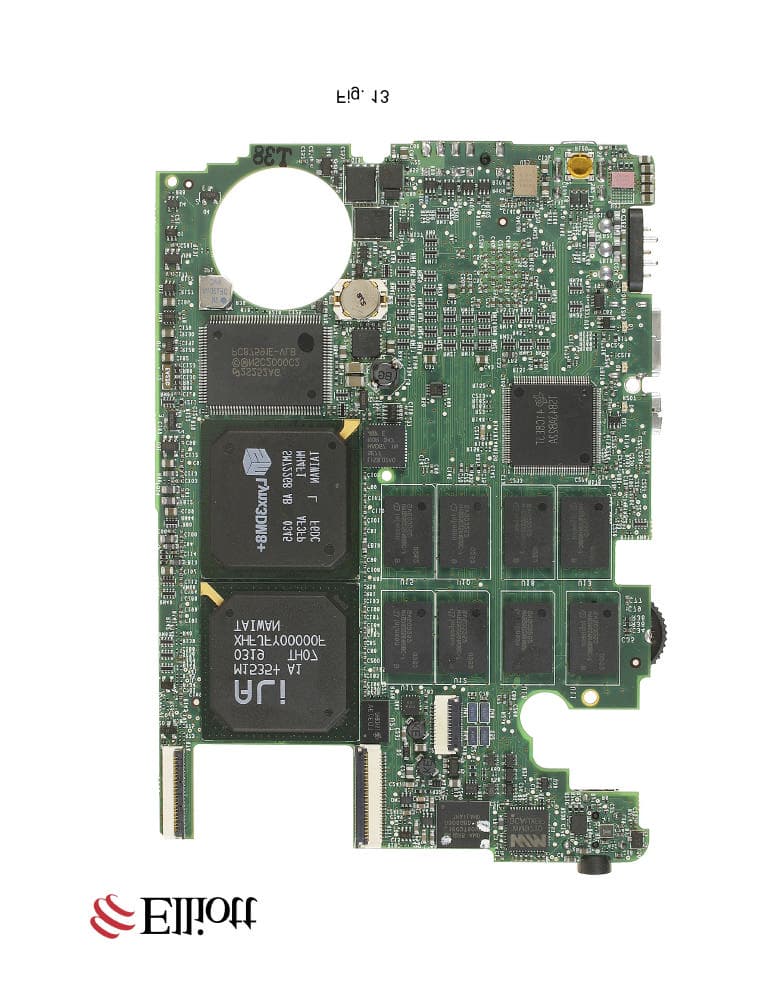
Click to zoom
Application Details
- Equipment Class
- DTS - Digital Transmission System
- Date of Grant
- Dec 16, 2004
- Application Purpose
- Original Equipment
- Date of Application
- Dec 16, 2004
- Equipment Note
- Handheld Computer
- Frequency Range
- 2412.00000000 - 2462.00000000
- Company
- OQO, Inc.
- Country
- United States
Documents & Files
Document Text
Text extracted from the exhibit documents filed with the FCC. Open a document above to read the original.
Users Manual
contents start guide part 1 introduction to the model 0102 part 2 powering up part 3 using the thumb keyboard and TrackStik part 4 using the digital pen and thumbwheel part 5 using the docking cable and desktop stand part 6 connecting to a network part 7 installing software and copying files 04 06 08 10 12 14 part 8 product support16 0302 part 1 introduction to the model 01 Welcome to the OQO model 01 ultra personal computer (uPC). The model 01 is a complete, full-featured computer. Docked at your desk it is a normal PC. Undock it and have instant access to all your applications and data, wherever you go. You can use the model 01 as a handheld computer with its own thumb keyboard, TrackStik ® , thumbwheel, and digital pen. You can also use it as a desktop computer by connecting it to an external monitor, keyboard, and mouse. When in transit, simply slip the model 01 into your pocket, briefcase, or bag. Because the model 01 uses the Microsoft ® Windows ® XP operating system, you can use it with all your favorite software applications and seamlessly integrate with existing networks via Ethernet, WiFi, or Bluetooth ® . This guide provides quick instructions for setting up and learning to operate your model01. To locate more detailed instructions, see “online documentation” on page 18. intro a d c b 0504 Your model 01 arrives with the battery attached. The first time you use the model 01, you must connect the power supply in order to power the computer and charge the battery. Connect the power supply to the model 01 as shown at right, then plug it into an outlet. The battery is charging whenever the computer is connected to an outlet through the power supply, regardless of whether the computer is turned on or off. The battery fuel gauge is located on the back of the battery. While the model 01 is charging, the battery fuel gauge lights flash in sequence. When the battery is not charging, the battery fuel gauge lights are unlit. To check the battery power level, push the battery fuel gauge button on the back of the battery. part 2 powering up During normal use, the fully-charged battery can provide about three hours of operating time. (For more information about maximizing battery life, see http://www.oqo.com/support/batterylife). To turn on your model 01, press the power button. The first time you do this, you must set up Windows XP. See the Start Hereguide for Windows XP, included with your computer. aPower supply bBattery cBattery fuel gauge button dPower button powering up a d c b e f 0706 When using your model 01 as a standalone handheld computer, you can use the thumb keyboard and TrackStik for input. Slide the screen upward to reveal the keyboard. The mouse buttons are located on the left edge of the keyboard. The keyboard is designed to be operated with your thumbs. Move the TrackStik with your thumb to control the mouse pointer. Use the left mouse button to left-click and the right mouse button to right-click. You can also connect an external keyboard and mouse to the model 01 via a USB port, Bluetooth, or the OQO docking cable. See “using the docking cable and desktop stand” on page 10. Unlike on a regular keyboard, the shift (SHIFT), function (FN), control (CTL), and alt (ALT) keys are all sticky. Press once and the LED next to it will flash, and the next key you hit will be affected. Press it twice to lock it and the LED will be on. All subsequent keys will be affected until you hit it again to unlock and the LEDturns off. Here are a few examples of operations using sticky keys: • To activate caps lock, press the SHIFT key twice. • To deactivate caps lock, press the SHIFT key a third time. • To activate the Task Manager, press FN- CTL-ALT-BSP. •To switch to an external display, press FN-L. • To turn WiFi on and off, press FN-”. aLeft mouse button bRight mouse button cSticky keys dENTER key eTrackStik fNumeric keypad part 3 using the thumb keyboard and TrackStik keyboard a d c b e 0908 Use the digital pen like this: •To select an object on the screen, touch it with the tip of the pen. •To drag an object, hold the pen over it and drag across the screen. To drop the object, lift the pen. •To double-click an object, tap it twice. • To right-click an object, select it and click the button located on the digital pen. Use the “Wacom Pen Settings” applet found in the Control Panel to change this behavior and calibrate the pen. It is important to calibrate your pen before you start to use it. Use only light pressure with the pen. The angle of the pen will affect its behavior. More information on the pen can be found at http:/www.oqo.com/support. aThumbwheel bDigital pen cTap to select dPen (right-click) button eAudio in/out part 4 using the digital pen and thumbwheel The thumbwheel can be used in multiple modes. Use the OQO Settings applet found in the Control Panel to change its behavior. By default, the thumbwheel works like this: •Click the thumbwheel once to display the current mode, then click again to toggle among the modes. •Double-click the thumbwheel to toggle between open applications or launch new applications. • In volume mode, rotate the wheel to the left to decrease the volume and to the right to increase it. • In vertical scrolling mode, rotate the wheel to the left to scroll up and to the right to scroll down. • In horizontal scrolling mode, rotate the wheel to the left to scroll left and to the right to scroll right. Remove the digital pen by pulling it out of the slot in the upper right corner of the OQO. more inputs a d c b e f 1110 When using the model 01 as a desktop computer, place it on the desktop stand to hold it in a convenient, upright position. The docking cable attaches to your model 01 as shown at right. When removing the docking cable from the docking connector, keep the cable straight, as twisting or angling it can damage the connector. It includes multiple ports that can be used simultaneously to connect a variety of peripheral devices: • Use the VGA port t…
Text truncated - open the document above for the full version.
Cover Letter(s)
American Telecommunications Certification Body Inc. 6731 Whittier Ave, McLean, VA 22101 November 3, 2004 RE: OQO FCC ID: SHD-A4YWFS After a review of the submitted information, I have a few comments on the above referenced Application. 1) The block diagram should show the frequencies of all oscillators in the TX portions (TX PCB’s) of the device (CFR 2.1033(a)(5)), unless this portion of the device is an OEM part. Please provide either the block diagram for the TX portions (802.11 + Bluetooth), or alternatively provide a parts list that shows that these parts are provided by another manufacturer. 2) The Bluetooth module theory of operation mentions that it is capable of up to +6 dBm output power. Antenna information suggests only a -1 to -3 dBi antenna. 3) Given that the device was not TX fully during AC line conducted measurements, please explain what precautions were taken during the test to ensure any contribution of the TX to the emissions could be adequately detected and evaluated. Given the short duration of the link pulses and sweep times of measurement equipment and/or automated measurements (where applicable), it is easy to overlook emissions that may be caused by the TX during these tests if not continuously Transmitting. Additionally, QP measurements on any pulsed may not adequately indicate compliance compared to longer durations of TX. Also average measurements would be given an unfair benefit during the test that would yield different results during continuous TX. Please explain or provide new test data as necessary. 4) Please explain why the bandedge frequency (page 31 and 35 of 80) shows bandedge measurements made at 2439 MHz for the low channel. The restricted band for the low channel that is typically measured is the worse case results obtained in the 2310-2390 MHz band. 5) When the gain of the antenna is known, typically output power made using field strength calculations should use the known gain of the antenna to achieve a known conducted output power according to the FCC guidance documents. It appears that this was not done and the EIRP power calculated instead. Please correct or explain as necessary to the power given on pages 33, 41, and 57 as necessary. 6) Please provide the RBW/VBW/Span/Sweep time settings for the spectral density test shown on page 33 & 41 of 80. Note for future reference: It is preferred that these plots be provided in the report when possible. 7) Please provide units for the field strength for output power shown in the tables on page 33, 41, and 57 of 80. 8) Please provide units for the output power for output power shown in tables on page 57. 9) It is uncertain why the power spectral density, power, and 6 dB bandwidth appear to be tested twice for 802.11b. Please explain. 10) Time of occupancy should be calculated over 0.4 * number of channels used (31.6 seconds in this case). Please correct as necessary. 11) Sufficient information to calculate dwell time in 31.6 seconds does not appear to have been provided. Please provide. 12) The labels on the plots on page 59 do not appear to match the information on the plots. 13) Bluetooth devices typically have 79 channels, not 75. It does appear that a few channels are not shown in the plots which may be simply from not enough storage time during the test. Please explain/correct as necessary. z Page 2 November 3, 2004 14) FYI.....Many times a Bluetooth device can be approved using DTS rules. In this case, approval is being asked for and shown in the report to both DTS (802.11b) and FHSS (Bluetooth) and therefore this is considered a composite application. If the Bluetooth can be shown to meet the DTS regulations, a single grant would be issued and this would not be considered a composite application for FCC. 15) FYI...For RX emissions (page 29 of 80), only AVG data was provided. There is also a limitation of the peak data, 20 dB higher than the AVG limit. This data should be included. 16) FYI....SAR Still under review. Timothy R. Johnson Examining Engineer mailto: [email protected] The items indicated above must be submitted before processing can continue on the above referenced application. Failure to provide the requested information may result in application termination. Correspondence should be considered part of the permanent submission and may be viewed from the Internet after a Grant of Equipment Authorization is issued. Please do not respond to this correspondence using the email reply button. In order for your response to be processed expeditiously, you must submit your documents through the AmericanTCB.com website. Also, please note that partial responses increase processing time and should not be submitted. Any questions about the content of this correspondence should be directed to the sender.
Cover Letter(s)
RE: OQO FCC ID SHD-A4YWFS Dear Sir, 1) The block diagram should show the frequencies of all oscillators in the TX portions (TX PCB’s) of the device (CFR 2.1033(a)(5)), unless this portion of the device is an OEM part. Please provide either the block diagram for the TX portions (802.11 + Bluetooth), or alternatively provide a parts list that shows that these parts are provided by another manufacturer. The modules for Bluetooth and 802.11b transceivers are provided by OEMs. The part numbers are: • Atmel AT76C505A 802.11b Wireless LAN USB module (this is a self contained module requiring only USB and power interface) • CSR BC219159 Single Chip Bluetooth module (this is a single chip solution that requires a reference crystal as shown in the block diagram) 2) The Bluetooth module theory of operation mentions that it is capable of up to +6 dBm output power. Antenna information suggests only a -1 to -3 dBi antenna. The antenna gain information does not account for the antenna’s location within the host device, and so the actual gain for the complete device is not known. The output power was set using the provided software to the maximum output level from the chip as configured. The radiated measurement does not account for any losses in the rf path from chip to antenna via diversity switch. 3) Given that the device was not TX fully during AC line conducted measurements, please explain what precautions were taken during the test to ensure any contribution of the TX to the emissions could be adequately detected and evaluated. Given the short duration of the link pulses and sweep times of measurement equipment and/or automated measurements (where applicable), it is easy to overlook emissions that may be caused by the TX during these tests if not continuously Transmitting. Additionally, QP measurements on any pulsed may not adequately indicate compliance compared to longer durations of TX. Also average measurements would be given an unfair benefit during the test that would yield different results during continuous TX. Please explain or provide new test data as necessary. Test data with both transmitters operating continuously and simultaneously has been added to the revised test report. 4) Please explain why the bandedge frequency (page 31 and 35 of 80) shows bandedge measurements made at 2439 MHz for the low channel. The restricted band for the low channel that is typically measured is the worse case results obtained in the 2310-2390 MHz band. This is a typo, frequency should read 2390 MHz. 5) When the gain of the antenna is known, typically output power made using field strength calculations should use the known gain of the antenna to achieve a known conducted output power according to the FCC guidance documents. It appears that this was not done and the EIRP power calculated instead. Please correct or explain as necessary to the power given on pages 33, 41, and 57 as necessary. At the time of testing the antenna gain was not known. Also, the gain of the antenna within the system is not accurately known, hence the output power is reported as EIRP. I have added a table to convert the EIRP to a conducted power based on a a nominal antenna gain of -3dBi. 6) Please provide the RBW/VBW/Span/Sweep time settings for the spectral density test shown on page 33 & 41 of 80. Note for future reference: It is preferred that these plots be provided in the report when possible. Settings were: RBW=VBW= 3kHz; Sweep time = 100seconds, Span = 300kHz. Comment also added to the test data file. Sorry that plots were not included this time. 7) Please provide units for the field strength for output power shown in the tables on page 33, 41, and 57 of 80. Data tables have been updated. 8) Please provide units for the output power for output power shown in tables on page 57. Data tables have been updated. 9) It is uncertain why the power spectral density, power, and 6 dB bandwidth appear to be tested twice for 802.11b. Please explain. As all measurements were made radiated (it was not possible to connect directly to the rf output of either module) the PSD was measured twice, once for each antenna. Although not necessary, the 6dB bandwidth was also measured twice. 10) Time of occupancy should be calculated over 0.4 * number of channels used (31.6 seconds in this case). Please correct as necessary. Only 75 channels were being used, therefore dwell time is over 30 seconds (0.4 * 75). 11) Sufficient information to calculate dwell time in 31.6 seconds does not appear to have been provided. Please provide. By providing the time between successive hops on a single channel the dwell time can be calculated (divide time between successive hops by the number of channels). The time between successive hops was measured several times to be the same value, and 75 channels were noted as being used in the channel occupancy plots. An addition plot to show the transmit time on a channel ( which is ont the same as the dwell time on a specific channel) has been added to the revised test data report. 12) The labels on the plots on page 59 do not appear to match the information on the plots. The plot title has been updated to reflect the correct number of channels in each plot. 13) Bluetooth devices typically have 79 channels, not 75. It does appear that a few channels are not shown in the plots which may be simply from not enough storage time during the test. Please explain/correct as necessary. The software used to control the device for testing would not put the device on the four “missing” channels. This could not be explained, since the test software (Bluetest) should have produced a hopping set across all channels. It was not possible to force the device to transmit continuously on the missing channels. 14) FYI.....Many times a Bluetooth device can be approved using DTS rules. In this case, approval is being asked for and shown in the report to both DTS (802.11b) and FHSS (Bluetooth) and therefore this is considered a composite applicatio…
Text truncated - open the document above for the full version.
Cover Letter(s)
November 10, 2004 RE: OQO FCC ID: SHD-A4YWFS 1) The revised report still mentions a bandedge frequency of 2439 MHz (See page 30 and 34). Please correct. Corrected, revised report uploaded. 2) The revised report still missing units for field strength on page 56. Corrected, revised report uploaded. 3) Please provide units for the output power for output power shown in tables on page 56 of the revised report. Corrected, revised report uploaded. 4) Although there was a concern with the test software for producing all 79 channels, please explain if the end use device will be using 79 channels. Note that if it is considered Bluetooth compliant, it is expected to use all 79 channels. Yes, the device will use the full Bluetooth protocol in normal operation. The inability to select the four channels is an issue with the test software for EMC testing. 5) If the device is not considered Bluetooth compliant, please provide detailed theory of operation information regarding pseudo-random hop lists, information regarding RX tracking the TX and having equal input bandwidths to the TX, and information on compliance to 15.247(g) & (h). Not applicable, see response to (5) above. 6) FYI....Model number or similar identification information should be placed on the same page in the users manual for the DoC compliance statement requirements. Noted – Model # is identified in DoC statement SAR Questions: 1) The SAR report cites power as conducted, but matches your EIRP power. Please explain. This was a typo, please see revised report. 2) The FCC normally expects the SAR facility to measure power to ensure device has proper output power for test and that sample has not been damaged. What precautions were taken to ensure the device was operating properly during the test and that the sample was operating as previously measured. For instance, was power measured before and after SAR by Elliott? Are there any concerns with the test software as well. Please explain. Pre- and post- SAR test measurements of fundamental signal strength made at Elliott were within a range of +/- 1dB (i.e. within the measurement uncertainty for a radiated field strength measurement). 3) This device is capable of transmit from either antenna. How was this factored into the testing. Note section 8.2 suggests both may have been evaluated, but it is not certain. Please see revised report. 4) From page 22 of the SAR report, it appears power was only measured from the antenna producing lower power. It would be expected that the highest be measured. Please see revised report. 5) For devices containing low power secondary transmitters < 5 mW (Bluetooth in this device), the FCC asks that the worse case positioning of the primary TX be tested with the secondary TX turned on and then off. The purpose of this testing is to show isolation of the 2 transmitters and the fact that the primary TX results are not affected. It appears this may not have been done. Please review and correct as necessary. FCC has accepted our procedure for collocated transmitters. In fact, our procedure was used as a model by FCC for its published collocation test procedures. 6) Please adjust the report to define if this device is a production unit or identical prototype. Identical prototype 7) Are there any battery options to consider for this device that must be tested? No 8) On the test photographs, it is uncertain the positioning of the antennas. This should be denoted when possible. The photos show the worst case setup. 9) The SAR report does not appear to procedures to establish the test signals described (put phone on a call, e.g., base-station simulator vs internal test codes)? This may include a test equipment list or test codes. Please see revised report. 10) Plots for the Validation do not appear to be provided. Please see revised report. 11) Was SAR evaluated with the keyboard open and shut? This mode should have been investigated. Please see revised report. 12) Are there any body worn accessories to be investigated for this device? NO 13) Information regarding Crest Factors does not appear on SAR plots. This should be provided on the plots. The IndexSAR system does not use crest factors. Diode compression factor (DCP) is used. DCP is determined during calibration of the probe. 14) Z-axis scan information does not appear to have been provided for worse case SAR measurements. Our phantoms liquid depth is 15 cm as shown in photos. Therefore according to IEEE 1528 z-axis scan is not required. 15) The dielectric parameters measured should be compared to and show to be < 5% from the expected values. They are. 16) The calibration information given for the verification dipole does not appear to match the date of the calibration information provided and that the device may be out of calibration. Cetecom extended the calibration period. Studies determined that an 18 month calibration cycle is sufficient. Also, the system validation is within specifications. 17) Users manual should mention to the user that the device has been evaluated for RF exposure conditions to the FCC requirements. Also, it appears that the statements of 15.21 may not be included in the manual. Please review. Corrected. This should resolve all concerns with the Manual, SAR and EMC reports. If you have any further comments or questions, please let us know. Thank you, Mark Briggs VP of Engineering
Cover Letter(s)
American Telecommunications Certification Body Inc. 6731 Whittier Ave, McLean, VA 22101 November 3, 2004 RE: OQO FCC ID: SHD-A4YWFS After a review of the submitted information, I have a few comments on the above referenced Application. 1) The revised report still mentions a bandedge frequency of 2439 MHz (See page 30 and 34). Please correct. 2) The revised report still missing units for field strength on page 56. 3) Please provide units for the output power for output power shown in tables on page 56 of the revised report. 4) Although there was a concern with the test software for producing all 79 channels, please explain if the end use device will be using 79 channels. Note that if it is considered Bluetooth compliant, it is expected to use all 79 channels. 5) If the device is not considered Bluetooth compliant, please provide detailed theory of operation information regarding pseudo-random hop lists, information regarding RX tracking the TX and having equal input bandwidths to the TX, and information on compliance to 15.247(g) & (h). 6) FYI....Model number or similar identification information should be placed on the same page in the users manual for the DoC compliance statement requirements. SAR Questions: 1) The SAR report cites power as conducted, but matches your EIRP power. Please explain. 2) The FCC normally expects the SAR facility to measure power to ensure device has proper output power for test and that sample has not been damaged. What precautions were taken to ensure the device was operating properly during the test and that the sample was operating as previously measured. For instance, was power measured before and after SAR by Elliott? Are there any concerns with the test software as well. Please explain. 3) This device is capable of transmit from either antenna. How was this factored into the testing. Note section 8.2 suggests both may have been evaluated, but it is not certain. 4) From page 22 of the SAR report, it appears power was only measured from the antenna producing lower power. It would be expected that the highest be measured. 5) For devices containing low power secondary transmitters < 5 mW (Bluetooth in this device), the FCC asks that the worse case positioning of the primary TX be tested with the secondary TX turned on and then off. The purpose of this testing is to show isolation of the 2 transmitters and the fact that the primary TX results are not affected. It appears this may not have been done. Please review and correct as necessary. 6) Please adjust the report to define if this device is a production unit or identical prototype. 7) Are there any battery options to consider for this device that must be tested? 8) On the test photographs, it is uncertain the positioning of the antennas. This should be denoted when possible. 9) The SAR report does not appear to procedures to establish the test signals described (put phone on a call, e.g., base-station simulator vs internal test codes)? This may include a test equipment list or test codes. 10) Plots for the Validation do not appear to be provided. 11) Was SAR evaluated with the keyboard open and shut? This mode should have been investigated. 12) Are there any body worn accessories to be investigated for this device. z Page 2 November 3, 2004 13) Information regarding Crest Factors does not appear on SAR plots. This should be provided on the plots. 14) Z-axis scan information does not appear to have been provided for worse case SAR measurements. 15) The dielectric parameters measured should be compared to and show to be < 5% from the expected values. 16) The calibration information given for the verification dipole does not appear to match the date of the calibration information provided and that the device may be out of calibration. 17) Users manual should mention to the user that the device has been evaluated for RF exposure conditions to the FCC requirements. Also, it appears that the statements of 15.21 may not be included in the manual. Please review. Timothy R. Johnson Examining Engineer mailto: [email protected] The items indicated above must be submitted before processing can continue on the above referenced application. Failure to provide the requested information may result in application termination. Correspondence should be considered part of the permanent submission and may be viewed from the Internet after a Grant of Equipment Authorization is issued. Please do not respond to this correspondence using the email reply button. In order for your response to be processed expeditiously, you must submit your documents through the AmericanTCB.com website. Also, please note that partial responses increase processing time and should not be submitted. Any questions about the content of this correspondence should be directed to the sender.
Cover Letter(s)
American Telecommunications Certification Body Inc. 6731 Whittier Ave, McLean, VA 22101 November 23, 2004 RE: OQO FCC ID: SHD-A4YWFS After a review of the submitted information, I have a few comments on the above referenced Application. SAR Questions: 1) Although the calibration interval may be 18 months, the dipole calibration information is dated for July 2002 while testing was in November 2004. Please provide current calibration information for the dipole. 2) Please explain a DCP of 19. A DCP of 19 does not appear in the calibration information. 3) The last response states that the dielectric parameters are within 5%. Please show this in a table comparing the measured values to the expected values. 3) FYI......Regardless of 15 cm, the FCC has asked that Z-axis scan information be provided with the SAR report. Checklists provided by the FCC have always included this. If available, please provide. If not, please be aware the FCC may still ask for this at a future time. Please be sure to include this in future applications. Timothy R. Johnson Examining Engineer mailto: [email protected] The items indicated above must be submitted before processing can continue on the above referenced application. Failure to provide the requested information may result in application termination. Correspondence should be considered part of the permanent submission and may be viewed from the Internet after a Grant of Equipment Authorization is issued. Please do not respond to this correspondence using the email reply button. In order for your response to be processed expeditiously, you must submit your documents through the AmericanTCB.com website. Also, please note that partial responses increase processing time and should not be submitted. Any questions about the content of this correspondence should be directed to the sender.
Internal Photos
Fig.1 top isometric view of product with the screen in the closed position. Fig.2 Bottom view of product. Fig.3 Bottom view with battery removed. Battery connector visible. Fig.4 Top view of product with the screen in the open position exposing the keyboard. Fig.5 Bottom view with sheet metal cover removed. Visible in view is the heatsink assembly, Hard drive, 802.11 module and 802.15 module Fig.6 Bottom view with Hard drive removed. Partial exposure of main logic board, also in view is the heatsink, 802.11 module and 802.15 module. Fig.7 Same view as Fig.6 with the EMI sheet metal cover removed from the 802.11 module. Fig.8 Top and bottom view of 802.11 module. Fig.9 Bottom view with heatsink removed, 802.11 module removed, and 802.15 module removed. Visible in view is the entire bottom side of the main logic board, and the right and left antenna coax cables. Fig.10 Bottom view of the heatsink/fan assembly and the 802.15/trackstick module with 802.15 antenna coax connected. Fig.11 Bottom view of main logic board Fig.12 Bottom view of main logic board removed from housing. Fig.13 Top view of main logic board removed from housing.
Operational Description
BLUETOOTH APPROVALS…
Text truncated - open the document above for the full version.
Contact Information
Applicant
Bob Hymes(Engineering Program Manager)
Technical Contact
Elliott Laboratories Inc.Mark Briggs
[email protected]408-245-7800
684 West Maude Ave. · Sunnyvale, California · United States
Non-Technical Contact
Elliott Laboratories Inc.David Guidotti
[email protected]408-245-7800
Test Firm
Elliott Laboratories LLCDavid Bare
Technical Specifications
| # | Rule Parts | Frequency Range | Power Output |
|---|---|---|---|
| 1 | 15C | 2.41 GHz - 2.46 GHz | 44.00 mW |
Other Applications from OQO, Inc.
SHD-A8YWFS
Sep 29, 2007Handheld Computer
Equipment Class
DSS - Part 15 Spread Spectrum Transmitter
SHD-A7YWFS
Apr 11, 2007Model 02
Equipment Class
PCB - PCS Licensed Transmitter
SHD-A6YWFS
Jan 16, 2007Model 02
Equipment Class
DTS - Digital Transmission System