OF2CLRUDD3AXXPCS Wireless Access Network
AT&T Wireless Services, Inc.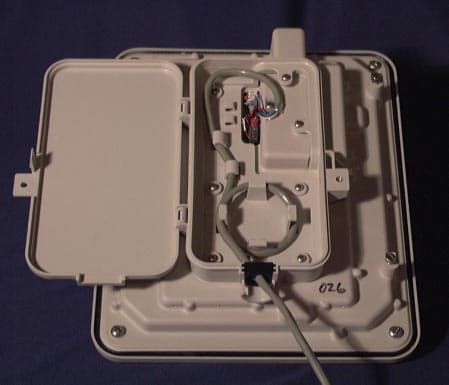
Click to zoom
Application Details
- Equipment Class
- PCB - PCS Licensed Transmitter
- Date of Grant
- Jun 03, 2001
- Application Purpose
- Original Equipment
- Date of Application
- Feb 24, 1999
- Equipment Note
- PCS Wireless Access Network
- Frequency Range
- 1850.00000000 - 1990.00000000
- Company
- AT&T Wireless Services, Inc.
- Country
- United States
Documents & Files
Document Text
Text extracted from the exhibit documents filed with the FCC. Open a document above to read the original.
Users Manual
Chapter 13:Users Manuals AT&T Wireless Services13-1 FCC Type Acceptance Application 10992 Rev. 1.0 3/4/99 Chapter 13Users Manuals A user manual has not been included within this Type Approval. This product is delivered, installed, and maintained by AT&T and/or authorized personal and incorporates limited access to the customer. The product is designed to be transparent and provides its designed function without customer care or involvement. RU FCC Regulatory Test Report 13-2AT&T Wireless Services FCC Type Acceptance Application 10992 Rev. 1.0 3/4/99
Attestation Statements
Chapter 1:Attestation Statements AT&T Wireless Services1-1 FCC Type Acceptance Application 10992 Rev. 1.0 3/4/99 Chapter 1Attestation Statements RU FCC Regulatory Test Report 1-2AT&T Wireless Services FCC Type Acceptance Application 10992 Rev. 1.0 3/4/99
Cover Letter(s)
Chapter 3:Cover Letters AT&T Wireless Services3-1 FCC Type Acceptance Application 10992 Rev. 1.0 3/4/99 . Chapter 3Cover Letters Overview There are no cover letters for submittal. RU FCC Regulatory Test Report 3-2AT&T Wireless Services FCC Type Acceptance Application .10992 Rev. 1.0 3/4/99
External Photos
Chapter 4:External Photographs AT&T Wireless Services4-1 FCC Type Acceptance Application 10992 Rev. 1.0 3/4/99 Chapter 4External Photographs Overview This section contains external photographs of the Remote Unit. Contents 4.1External Photographs . . . . . . . . . . . . . . . . . . . . . . . . . . . . . . . . . . . . 4-2 RU FCC Regulatory Test Report 4-2AT&T Wireless Services FCC Type Acceptance Application 10992 Rev. 1.0 3/4/99 4.1External Photographs The front face of the Remote Unit has an HB plastic radome which connects to a metallic back frame, as shown inFigure D.1. The radome, which covers the antenna, measures approximately 12 in. by 14 in. Figure D.1RU R1- Complete Unit - Front Radome Chapter 4:External Photographs AT&T Wireless Services4-3 FCC Type Acceptance Application 10992 Rev. 1.0 3/4/99 Figure D.2 shows the Remote Unit, which identifies the interconnecting cable cover. Like the radome, the cable cover is constructed from HB plastic material housing the I/O connectors and provides tension relief. The cable cover is not accessible when the RU is attached to the mounting bracket. Figure D.2RU R1 -Complete Unit - Back Cable Cover RU FCC Regulatory Test Report 4-4AT&T Wireless Services FCC Type Acceptance Application 10992 Rev. 1.0 3/4/99 Figure D.3 shows an open cable cover exposing the interconnecting cable and I/O connectors. As shown inFigure D.3, a grounding conductor is attached to the board and chassis grounds. A cable tension relief is shown molded into the cable cover. Figure D.3RU R1 - Complete Unit - Back Cable Connection
ID Label/Location Info
Chapter 5:ID Label/Location Information AT&T Wireless Services5-1 FCC Type Acceptance Application 10992 Rev. 1.0 3/4/99 Chapter 5ID Label/Location Information Overview This section contains ID label and location information. Contents 5.1ID Label . . . . . . . . . . . . . . . . . . . . . . . . . . . . . . . . . . . . . . . . . . . . . . 5-2 5.2Location Information . . . . . . . . . . . . . . . . . . . . . . . . . . . . . . . . . . . . 5-3 RU FCC Regulatory Test Report 5-2AT&T Wireless Services FCC Type Acceptance Application 10992 Rev. 1.0 3/4/99 5.1ID Label Figure 5.1Example FCC ID Label Chapter 5:ID Label/Location Information AT&T Wireless Services5-3 FCC Type Acceptance Application 10992 Rev. 1.0 3/4/99 5.2Location Information Figure 5.2FCC ID Label Location on Product Figure 5.3Close-up of FCC Label on Product RU FCC Regulatory Test Report 5-4AT&T Wireless Services FCC Type Acceptance Application 10992 Rev. 1.0 3/4/99
RF Exposure Info
Chapter 9:RF Exposure Information AT&T Wireless Services9-1 FCC Type Acceptance Application 10992 Rev. 1.0 3/4/99 Chapter 9RF Exposure Information Overview This chapter contains information as to how the product was determined compliant with FCC Part 24 subsection 24.51 Contents 9.1RF Human Exposure - FDTD Analysis and SAR Testing . . . . . . . . 9-2 RU FCC Regulatory Test Report 9-2AT&T Wireless Services FCC Type Acceptance Application 10992 Rev. 1.0 3/4/99 9.1RF Human Exposure - FDTD Analysis and SAR Testing 9.1.1Applicable FCC Rules FCC Subpart 24.51 - Applications for Type Approval of transmitters operating within the PCS region must determine that the equipment complies with IEEE C95.1-1991, “IEEE Standards for Safety Levels with Respect to Human Exposure to Radio Frequency Electromagnetic Fields, 3 kHz to 300 GHz” as measured using methods specified in IEEE C95.3 - 1991, “Recommended Practice for the Measurement of Potentially Hazardous Electromagnetic Fields - RF and Microwave.” 9.1.2Test Configuration RF human exposure configurations were setup, tested, and evaluated by the following independent laboratories: Bioelectromagnetics Consulting, 18122 60th Pl. N.E., Kenmore, Washington 98028, with Dr. William Guy as primary consultant, responsible for carrying out the FDTD numerical analysis of the near fields, far fields, and SAR distributions from the Remote Unit antenna. As primary consultant, additional responsibilities included the evaluation and analysis of the SAR data from the independent SAR measurement laboratories. Schmid & Partner Engineering AG (SPEAG), Staffelstrasse 8, 8045 Zurich, Switzerland, with Dr. Neils Kuster as the project director, who was responsible for carrying out measurements of the near and far fields from the Remote Unit antenna and SAR distribution in homogeneous phantom head and a flat rectangular tissue models exposed to the antenna fields. SARTest Ltd., Oakfield Laboratories, Cudworth Lane, Newdigate, Surrey RH5 5DR. UK., with M.I. Manning as project director, who was responsible for carrying out measurements of the near and far fields from the Remote Unit antenna and SAR distribution in a heterogeneous phantom head model and a flat heterogeneous rectangular tissue model exposed to the antenna fields. Chapter 9:RF Exposure Information AT&T Wireless Services9-3 FCC Type Acceptance Application 10992 Rev. 1.0 3/4/99 9.1.3Test Results Bioelectromagnetics Consulting compiled and correlated all data pertaining to FCC Subpart 24.51, and found the product to be compliant with this rule part. RU FCC Regulatory Test Report 9-4AT&T Wireless Services FCC Type Acceptance Application 10992 Rev. 1.0 3/4/99
RF Exposure Info
EVALUATION OF THE RF EMISSION AND EXPOSURE OF HUMANS TO THE AT&T WIRELESS SERVICES FIXED WIRELESS RU ANTENNA IN TERMS OF COMPLIANCE WITH FCC GENERAL POPULATION RF EXPOSURE STANDARDS January 12, 1999 A Report Prepared for Mr. Keith Peavler Senior EMC Engineer Strategic Technology Group AT&T Wireless Services Redmond, Washington 98073-9759 By Arthur W. Guy, Ph.D. Bioelectromagnetics Consulting 18122 60 th PL NE Kenmore, Washington 98028 AT&T RU Antenna - January 12, 1999 TABLE OF CONTENTS EXECUTIVE SUMMARY.......................................................................................1 1INTRODUCTION................................................................................................................4 2COMPUTER HARDWARE AND SOFTWARE USED FOR PERFORMING CALCULATIONS.......................................................................................................................5 2.1COMPUTER HARDWARE...............................................................................................................5 2.2COMPUTER SOFTWARE................................................................................................................5 3FDTD MODELS.................................................................................................................6 3.1ANTENNA MODEL.......................................................................................................................6 3.2KUSTER HOMOGENEOUS HEAD MODEL........................................................................................7 3.2.1Nose of Model Centered Over Geometric Center of Patch Array........................................8 3.2.2Nose of Model Centered Over Geometric Center of Lower Right Patch..............................8 3.3REMCOM HEAD AND SHOULDERS MODEL.................................................................................8 3.4INHOMOGENEOUS RECTANGULAR SLAB TORSO MODEL................................................................9 4ANTENNA FAR FIELD RADIATION PATTERN CALCULATIONS...................................21 5ANTENNA NEAR FIELD CALCULATIONS......................................................................27 5.1ANTENNA MODEL GEOMETRY...................................................................................................27 5.2ELECTRIC FIELD CALCULATIONS AND MEASUREMENTS..............................................................28 5.3ANTENNA MAGNETIC FIELD CALCULATIONS AND MEASUREMENTS............................................51 6FDTD CALCULATION AND MEASUREMENTS OF SAR IN KUSTER HEAD AND SHOULDERS HOMOGENEOUS MODEL.................................................................................71 6.1ORIENTATION WITH TIP OF NOSE IN CONTACT WITH RADOME AND 9 MM BELOW CENTER OF FOUR PATCH ARRAY....................................................................................................................................71 6.2ORIENTATION WITH TIP OF NOSE IN CONTACT WITH RADOME AND CENTERED OVER LOWER RIGHT PATCH...............................................................................................................................................97 6.3ORIENTATION WITH SIDE OF HEAD IN CONTACT WITH RADOME IN VARIOUS POSITIONS...............107 7FDTD CALCULATION OF SAR IN REMCOM HEAD AND SHOULDERS INHOMOGENEOUS MODEL..................................................................................................120 8FDTD CALCULATION OF SAR IN INHOMOGENEOUS RECTANGULAR SLAB TORSO MODEL...................................................................................................................................138 8.1EXPOSURE TO DOUBLE FEED ANTENNA.....................................................................................138 8.2EXPOSURE TO SINGLE FEED ANTENNA......................................................................................172 9FDTD CALCULATION OF SAR IN HOMOGENEOUS RECTANGULAR SLAB TORSO MODEL...................................................................................................................................179 10CONCLUSIONS.............................................................................................................189 11REFERENCES...............................................................................................................190 APPENDIX A APPENDIX B APPENDIX C AT&T RU Antenna - January 12, 1999 1 Executive Summary This is a report on the evaluation of the AT&T Wireless Services Fixed Wireless RU Antenna in terms of its compliance with United States Federal Communications Commission (FCC)(1996) general population radio frequency (RF) maximum permitted human exposure limit (MPL). The report was completed according to the terms of a Services Agreement between AT&T Wireless Services (ATTWS) and Bioelectromagnetics Consulting (BEMC) signed on September 18, 1997. BEMC completed the following tasks with results described in this report: Performed theoretical calculations of the gain, radiation patterns, near fields and far fields of the AT&T RU antenna and compared the results with the FCC MPL and measurements of the values from other laboratories. Performed theoretical calculations of the specific absorption rate (SAR) distributions in four models exposed to the AT&T RU antenna. The models consisted of the SPEAG homogeneous phantom human head also occasionally referred to in this report as the Kuster homogeneous head model, the REMCOM inhomogeneous phantom head, an inhomogeneous flat rectangular slab phantom (including skin, subcutaneous fat and muscle) and a homogeneous slab muscle model. The calculated SARs expressed in the form of tables, two dimensional color contour plots and line graphs were compared to the FCC and ANSI/IEEE (1992) MPLs and measurements of the values from other laboratories. Assisted ATTWS in directing and verifying criteria such as methods, procedures, testing, models, results and other related events in the commissioning of two …
Text truncated - open the document above for the full version.
RF Exposure Info
AT&T RU Antenna - January 12, 1999 32 32 Figure 5.2. FDTD derived total E-field at of AT&T RU antenna in y-z plane (Scan H, 40 mm from ground plane of antenna for comparison with measured data). Scale 0 dB = 41.85 V/m AT&T RU Antenna - January 12, 1999 33 Figure 5.3. FDTD derived x component of E-field at of AT&T RU antenna in z-y plane (Scan H, 40 mm from ground plane of antenna for comparison with measured data). AT&T RU Antenna January 12, 1999 34 Figure 5.4. FDTD derived y component of E-field of AT&T RU antenna in y-z plane (Scan H, 40 mm from ground plane of antenna for comparison with measured data).
RF Exposure Info
AT&T RU Antenna - January 12, 1999 35 Figure 5.5. FDTD derived z component of E-field of AT&T RU antenna in y-z plane (Scan H, 40 mm from ground plane of antenna for comparison with measured data). AT&T RU Antenna - January 12, 1999 36 Figure 5.6. FDTD derived E-field of AT&T RU antenna in y-z plane compared to ANSI/IEEE exposure standard (Scan I, 79 mm from ground plane of antenna, maximum E-field strength = 28.2 V/m). AT&T RU Antenna - January 12, 1999 37 37 Figure 5.7. FDTD derived E-field of AT&T RU antenna in y-z plane compared to ANSI/IEEE exposure standard (Scan J, 91 mm from ground plane of antenna, maximum E-field strength =29.42 V/m).
RF Exposure Info
AT&T RU Antenna - January 12, 1999 38 38 Figure 5.8. FDTD derived E-field of AT&T RU antenna in y-z plane compared to ANSI/IEEE exposure standard (Scan K, 151 mm from ground plane of antenna, maximum E-field strength =32.55 V/m). AT&T RU Antenna - January 12, 1999 39 Figure 5.9. FDTD derived E-field of AT&T RU antenna in y-z plane compared to ANSI/IEEEexposure standard (Scan L, 211 mm from ground plane of antenna, maximum E-field strength = 30.80 V/m). AT&T RU Antenna - January 12, 1999 40 Figure 5.10. FDTD derived E-field of AT&T RU antenna in y-z plane compared to ANSI/IEEE exposure standard (Scan M, 229 mm from ground plane of antenna, maximum E-field strength = 29.89 V/m).
RF Exposure Info
AT&T RU Antenna - January 12, 1999 41 Figure 5.11. FDTD derived E-field of AT&T RU antenna in y-z plane compared to ANSI/IEEE exposure standard (Scan N, 331 mm from ground plane of antenna, maximum E-field strength = 24.25 V/m). AT&T RU Antenna - January 12, 1999 42 Figure 5.12. FDTD derived E-field of AT&T RU antenna in y-z plane compared to ANSI/IEEE exposure standard (Scan O, 451 mm from ground plane of antenna, maximum E-field strength = 19.03 V/m). AT&T RU Antenna - January 12, 1999 43 Figure 5.13. FDTD derived E-field of AT&T RU antenna in y-z plane compared to ANSI/IEEE exposure standard (Scan Q, 541 mm from ground plane of antenna, maximum E-field strength = 16.18 V/m).
RF Exposure Info
AT&T RU Antenna - January 12, 1999 44 Figure 5.14. FDTD derived E-field of AT&T RU antenna in x-y plane compared to ANSI/IEEE exposure standard (Scan A, horizontal plane through middle of top patches). AT&T RU Antenna - January 12, 1999 45 Figure 5.15. FDTD derived E-field of AT&T RU antenna in x-y plane compared to ANSI/IEEE exposure standard (Scan B, horizontal plane through middle of patch array). AT&T RU Antenna - January 12, 1999 46 Figure 5.16. FDTD derived E-field of AT&T RU antenna in x-y plane compared to ANSI/IEEE exposure standard (Scan C, horizontal plane through middle of bottom patches).
RF Exposure Info
AT&T RU Antenna - January 12, 1999 47 Figure 5.17. FDTD derived E-field of AT&T RU antenna in x-y plane compared to ANSI/IEEE exposure standard (Scan D, vertical plane through middle of right row of patches). AT&T RU Antenna - January 12, 1999 48 Figure 5.18. FDTD derived E-field of AT&T RU antenna in x-y plane compared to ANSI/IEEE exposure standard (Scan E, vertical plane through middle of patch array). AT&T RU Antenna - January 12, 1999 49 Figure 5.19. FDTD derived E-field of AT&T RU antenna in x-y plane compared to ANSI/IEEE exposure standard (Scan F, vertical plane through middle of left row of patches).
RF Exposure Info
AT&T RU Antenna - January 12, 1999 50 Figure 5.20. Comparison of FDTD derived values of electric field strength by BEMC, measured values by SARTest (SARTest1 lowest and SARTest2 highest), measured values by SPEAG, measured values at AT&T Wireless Services laboratory and calculated values by theoretical far field equation from AT&T RU antenna. AT&T RU Antenna - January 12, 1999 51 5.3 Antenna Magnetic Field Calculations and Measurements Figure 5.21 illustrates a color contour graph of the calculated near-zone magnetic field (H-field) along the plane denoted by G at the surface of the radome, 31-mm from the surface of the ground plane. The color legend is scaled in dB with 0 dB corresponding to the maximum calculated H-field strength of 0.1236 A/m occurring near the lower right patch of the antenna at the location marked with a black plus sign. The calculated H-field distribution closely agrees with values measured by SPEAG shown in Figure 2.4 on page 13 of Appendix A for a 30-mm distance from the ground plane. This worst case calculated H-field is 2.4 dB below the FCC MPL of 0.163 A/m. Figure 5.22 illustrates the graph of the calculated total H-field distribution and Figures 5.23, 5.24 and 5.25 illustrate the graphs of the respective x, y and z, H-field components at 40-mm from the antenna ground plane. The SPEAG measurements for these fields are illustrated in Figures 2.3 and 2.5 of Appendix A for 1 watt input power. The field distributions appear similar to the calculated values when the magnitude of the fields are normalized to the same input power and the directions of the field components are expressed in the same terms. Table 5.2 indicates that the values compare favorably within the measurement accuracy stated by the authors of Appendices A and B. Table 5.2. Comparison from Different Laboratories of Maximum Calculated and Measured H-Field Strengths (A/m) in Plane Parallel to and 40-mm From Front of ATTWS RU Antenna Ground Plane with 79.62 mW Input Power at 1.92 GHz. LaboratoryTotalVertical fieldHorizontal fieldNormal field BEMC (FDTD)0.11050.01680.09990.0441 SPEAG (Measured)0.10770.02440.10670.0625 Figures 5.26 through 5.31 illustrate the respective color plots of the magnetic field (H-field) distribution in the yz planes for increasing values x away from the antenna. The planes correspond to those labeled I through K, M, N and P shown in Figures 3.1, 3.2 and 3.3. The legend for each of these plots and all remaining plots in this section is set to allow the color red to represent all field strengths at or greater than the value (0.163 A/m or 1 mW/cm 2 equivalent power density) allowed by the FCC MPL. The three vertical red lines play the same role as described for the E-field plots. Figure 5.26 illustrates that the maximum magnitude of the H-field distribution just within 5.0 cm distance from the radome (new minimum measurement distance recently approved by the IEEE SCC-28) is 0.06834 A/m which is 7.55 dB below the ANSI/IEEE and FCC MPLs. Figure 5.29 illustrates that the maximum magnitude of the H-filed distribution just within 20-cm AT&T RU Antenna - January 12, 1999 52 distance from the radome (current minimum measurement distance allowed by the ANSI/IEEE and the FCC) is 0.07986 A/m, which is 6.2 dB below the MPLs. Figures 5.32 through 5.34 illustrate the respective color plots of the H-field distribution in the xy planes identified by A, B and C and Figures 5.35 through 5.37 illustrate the respective color plots of the H-field distribution in the xz plane identified by D, E and F. The FDTD derived E-field data from the graphs discussed above are compared to the measurements made by SPEAG (given in Appendix A) in Figure 54. The graph in Figure 5.38 shows the BEMC FDTD derived values as a solid blue line while the SPEAG measurements are shown as red delta symbols. The results show excellent agreement within 0.22 dB. At all distances of 20 cm or more from the antenna radome the H-fields are 5.5 dB or more below the ANSI/IEEE and FCC MPLs. In the near field region of the antenna the H-field distribution is different than that of the E-field distribution but the distributions become identical with increasing distance from the source. Thus in the far field the measurement or calculation of either the electric field or the magnetic field will provide the proper power density but both must be quantified in the near zone of the antenna to insure that the maximum equivalent power density is properly characterized. AT&T RU Antenna - January 12, 199953 Figure 5.21. FDTD derived H-field at surface of radome of AT&T RU antenna in y-z plane (Scan G, 31 mm from ground plane of antenna, maximum H-field denoted by black plus sign). AT&T RU Antenna - January 12, 199954 Figure 5.22. FDTD derived total H-field of AT&T RU antenna in y-z plane (Scan H, 40 mm from ground plane of antenna for comparison with measured data). AT&T RU Antenna - January 12, 199955 Figure 5.23. FDTD derived x component of H-field at of AT&T RU antenna in z-y plane (Scan H, 40 mm from ground plane of antenna for comparison with measured data). AT&T RU Antenna - January 12, 199956 Figure 5.24. FDTD derived y component of H-field at of AT&T RU antenna in z-y plane (Scan H, 40 mm from ground plane of antenna for comparison with measured data). AT&T RU Antenna - January 12, 199957 Figure 5.25. FDTD derived z component of H-field at of AT&T RU antenna in z-y plane (Scan H, 40 mm from ground plane of antenna for comparison with measured data).
RF Exposure Info
AT&T RU Antenna - January 12, 199958 Figure 5.26. FDTD derived H-field of AT&T RU antenna in y-z plane compared to ANSI/IEEE exposure standard (Scan I, 79 mm from ground plane of antenna, maximum magnetic field strength = 0.06834 A/m). AT&T RU Antenna - January 12, 199959 Figure 5.27. FDTD derived H-field of AT&T RU antenna in y-z plane compared to ANSI/IEEE exposure standard (Scan J, 91 mm from ground plane of antenna, maximum magnetic field strength = 0.07081 A/m). AT&T RU Antenna - January 12, 199960 Figure 5.28. FDTD derived H-field of AT&T RU antenna in y-z plane compared to ANSI/IEEE exposure standard (Scan K, 151 mm from ground plane of antenna, maximum magnetic field strength = 0.08600 A/m). AT&T RU Antenna - January 12, 199961 Figure 5.29. FDTD derived H-field of AT&T RU antenna in y-z plane compared to ANSI/IEEE exposure standard (Scan M, 229 mm from ground plane of antenna, maximum magnetic field strength = 0.07986 A/m).
RF Exposure Info
AT&T RU Antenna - January 12, 199962 Figure 5.30. FDTD derived H-field of AT&T RU antenna in y-z plane compared to ANSI/IEEE exposure standard (Scan N, 331 mm from ground plane of antenna, maximum magnetic field strength = 0.06461 A/m). AT&T RU Antenna - January 12, 199963 Figure 5.31. FDTD derived H-field of AT&T RU antenna in y-z plane compared to ANSI/IEEE exposure standard (Scan P, 514 mm from ground plane of antenna, maximum magnetic field strength = 0.04496 A/m). AT&T RU Antenna - January 12, 199964 Figure 5.32. FDTD derived H-field of AT&T RU antenna in x-y plane compared to ANSI/IEEE exposure standard (Scan A, horizontal plane through middle of top patches). AT&T RU Antenna - January 12, 199965 Figure 5.33. FDTD derived H-field of AT&T RU antenna in x-y plane compared to ANSI/IEEE exposure standard (Scan B, horizontal plane through middle of patch array).
RF Exposure Info
AT&T RU Antenna - January 12, 199966 Figure 5.34. FDTD derived H-field of AT&T RU antenna in x-y plane compared to ANSI/IEEE exposure standard (Scan C, horizontal plane through middle of bottom patches). AT&T RU Antenna - January 12, 199967 Figure 5.35. FDTD derived H-field of AT&T RU antenna in x-z plane compared to ANSI/IEEE exposure standard (Scan D, vertical plane through middle of right row of patches). AT&T RU Antenna - January 12, 199968 Figure 5.36. FDTD derived H-field of AT&T RU antenna in x-z plane compared to ANSI/IEEE exposure standard (Scan E, vertical plane through middle of patch array). AT&T RU Antenna - January 12, 199969 Figure 5.37. FDTD derived H-field of AT&T RU antenna in x-z plane compared to ANSI/IEEE exposure standard (Scan F, vertical plane through middle of left row of patches).
RF Exposure Info
AT&T RU Antenna - January 12, 199970 Figure 5.38. Comparison of FDTD derived values of magnetic field strength by BEMC and measured values by SPEAG from AT&T antenna. AT&T RU Antenna - January 12, 1999 71 6 FDTD Calculation and Measurements of SAR in Kuster Head and Shoulders Homogeneous Model 6.1 Orientation with Tip of Nose in Contact with Radome and 9 mm Below Center of Four Patch Array FDTD calculations were made of the peak and 1-gram average of the SARs in the Kuster homogeneous head model (described in section 3.2) exposed to the AT&T RU antenna. The results were compared to the measurements made by SPEAG described in Appendix A. The electrical properties of the head tissue corresponded to a relative permittivy of 41.0 and a conductivity of 1.69 S/m, which SPEAG specifies for modeling homogeneous head tissue in the PCS band based on their measurements at 1.8 GHz. The head was exposed with the face toward the antenna with the nose in direct contact with the radome at 9-mm below the geometric center of the 4-patch array. Graphical SAR data files and plots calculated throughout the entire head model were scaled for an input power of 79.62 mW to the antenna which corresponds to a far-field effective radiated power of 2.54 watts from the antenna with no models present. Table 6.1 summarizes the calculated results of both the peak and average SARs calculated for each 1-mm thick slice in the xy plane as well as for the entire exposed head model. The first column of the table lists the first 17 characters of the name of the file containing the SAR data for the slices numbered from 11 to 344, corresponding to the distance in mm from the fdtd mesh origin in the z direction. The second and third columns of the table give the x and y coordinates in mm of the cell from the FDTD mesh origin within the slice experiencing the highest SAR. The fourth column gives the maximum SAR, the fifth column gives the SAR as averaged over the slice and the last column gives the number of cells within the slice. It may be noted from the table that the maximum SAR of 0.194 W/kg for the entire head model is in the 148 th slice (file mansar1.xy148.sar) at x=81 mm and y=109 mm and the average SAR for the 19114 cells for that slice is 0.007947 W/kg. It can also be seen at the bottom of the table that the SAR as averaged over the 7444294 cells of the entire head is 0.004295W/kg. The safe exposure standards in the United States for the public or uncontrolled environment including the FCC MPLs are based on limiting the maximum SAR as averaged over any gram of tissue in the shape of a cube to 1.6 W/kg and the SAR as averaged over the whole body to 0.08 W/kg. Thus the FDTD calculated SAR distribution data must be converted some way to reflect the average over any gram of tissue in the shape of a cube. So far there is no standardization on how this averaging process should be done to account for the irregular shape of tissue AT&T RU Antenna - January 12, 1999 72 boundaries such as encountered at the ears, nose, mouth, etc. If the averaging routine maintains the 1-gram cube entirely within the tissue boundaries so that a flat face of the cube cannot emerge outside of the tissue boundaries, the averaging process may miss regions of high SAR which commonly occur at the surface or at locations where there are sharp curves of the tissue surface. This will result in a lower average SAR than would be the case if the surfaces of the cube were allowed to extend beyond the tissue boundaries in order not to miss any tissue with high SAR near an irregular boundary. The latter could include a large amount of air in the averaging volume, requiring the cube to become larger to encompass the required gram of tissue thereby allowing more surface tissue with the higher SARs to weight the averaging process. In order to insure that the averaging process covers the “worst case” scenario, the FDTD averaging routine used in this analysis considered a cube of space centered at each FDTD cell within the tissue. The cube was then allowed to expand until a gram of tissue was contained within its boundaries. When 1 gram of tissue (to within 1% accuracy) was contained in the cube the SAR was averaged over the entire cube and the average value was assigned to the cell at the center of the cube. It should be realized that this could lead to pessimistically higher values of SAR at distances from the tissue surface that are shorter than the dimension of the averaging cube. The routine could be made to be less pessimistic by imposing an additional condition that the face of the averaging cube not be extended into the air anymore than necessary to enclose all of the tissue below the outermost point of the tissue boundary. It could become rather complicated to get some general agreement among the dosimetry experts on the best way to do this. Table 6.2 illustrates the results of the 1-gram averaging of the fdtd output data. The format is essentially the same as used in Table 6.1, except the results can now be related to the FCC MPL. It may be noted from the table that the highest 1-g average SAR of 0.1319 W/kg occurs in the slice at z=144 mm, x=81 mm and y=112 mm. This is more than 12 times below the maximum permitted level of 1.6 W/kg. The SAR as averaged over the entire head consisting of 7,444,294 fdtd cells was calculated to be 0.004319 W/kg. However, the whole head average of 0.004295 W/kg as calculated by 1-mm fdtd cubes given in Table 6.1 is more accurate since there is considerable overlapping of the 1 gram cubes in determining the whole head average given in Table 6.2. Assuming an average head tissue density the same as water, the total mass of the phantom head tissue is 7,444…
Text truncated - open the document above for the full version.
Contact Information
Applicant
Douglas I Brandon(Vice President)
Technical Contact
AT&T Wireless Services, Inc.Keith Peavler
[email protected]425-702-2914
Redmond, Washington · United States
Non-Technical Contact
AT&T Wireless Services, Inc.Lisa M Volpe
[email protected]202-223-9222
Technical Specifications
| # | Rule Parts | Frequency Range | Power Output | Emission | Tolerance |
|---|---|---|---|---|---|
| 1 | 24 | 1.85 GHz - 1.99 GHz | 2 W | 1M00W7W | 1.0000000000 ppm |
Other Applications from AT&T Wireless Services, Inc.
OF2FWBASE15PCS
Dec 06, 2001fixed wireless base station
Equipment Class
PCB - PCS Licensed Transmitter
OF2FWBASE15WCS
Jul 22, 2001fixed wireless base station
Equipment Class
TNB - Licensed Non-Broadcast Station Transmitter
OF2FWBASE
Jun 28, 2001PCB - PCS Licensed Transmitter
Equipment Class
PCB - PCS Licensed Transmitter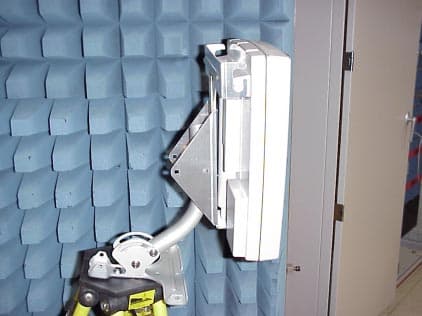
OF2WCSR30
Jun 28, 2001fixed wireless base station
Equipment Class
TNB - Licensed Non-Broadcast Station Transmitter
OF2PCSR30
Jun 03, 2001Fixed Wireless Base Station
Equipment Class
PCB - PCS Licensed Transmitter